
Horizontal scanning.
Who is probing our network.
New groups of external sources keep contacting large portions of the Politecnico address space. Some divide the targets with very little overlap. An analysis of the scanning infrastructures observed during the PHP2SHELL emergency.
Follow the arrival of scannersHow are the sources exploring the network organised? The observations reveal recurring horizontal scanning, sometimes consistent with a division of work across multiple external addresses.
There is no clear increase attributable to the new vulnerability. The analysis describes connection attempts and target distribution; it does not identify application-level exploitation of PHP2SHELL.
From services to sources.
Part A describes the effects on services. Here we follow external clients and the internal addresses they attempt to reach.
Count the attempts that fail, too.
A scan may contact thousands of addresses without finding an active service. Reconstructing it requires both completed connections and attempts that do not complete TCP connection establishment.
Across the four days, the data contain approximately 67.7 million connections and attempts, from approximately 3.56 million external addresses. The data considered concern TCP port 443.
New here, within the observation period.
Each of the 2,186 selected sources contacts at least 50 distinct internal IPs over the entire period and was not observed before the chosen time boundary.
“New” does not mean new to the Internet, or never previously seen at Politecnico: the available history starts on 20 October. Selection measures target breadth, not byte volume.
The actual selection window. In the available results, selection starts at 15:00 on 20 October on the Tstat clock: one hour before the unofficial disclosure marker. The official disclosure is marked at 15:00 on 21 October. These results therefore also include the 24 hours preceding the official marker.
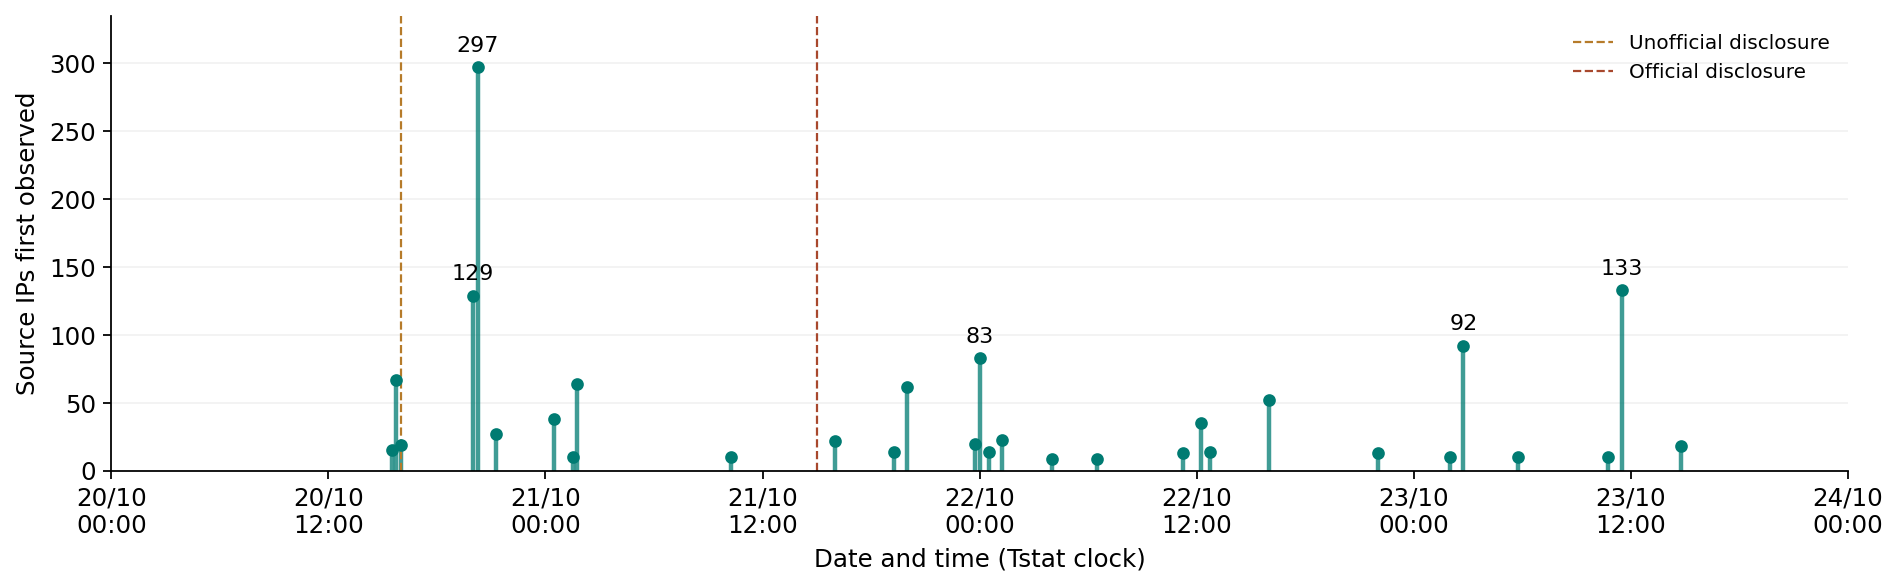
New sources arrive in waves.
Alongside isolated arrivals, groups of IPs begin contacting the network within the same interval. Some disappear quickly; others persist or reappear.
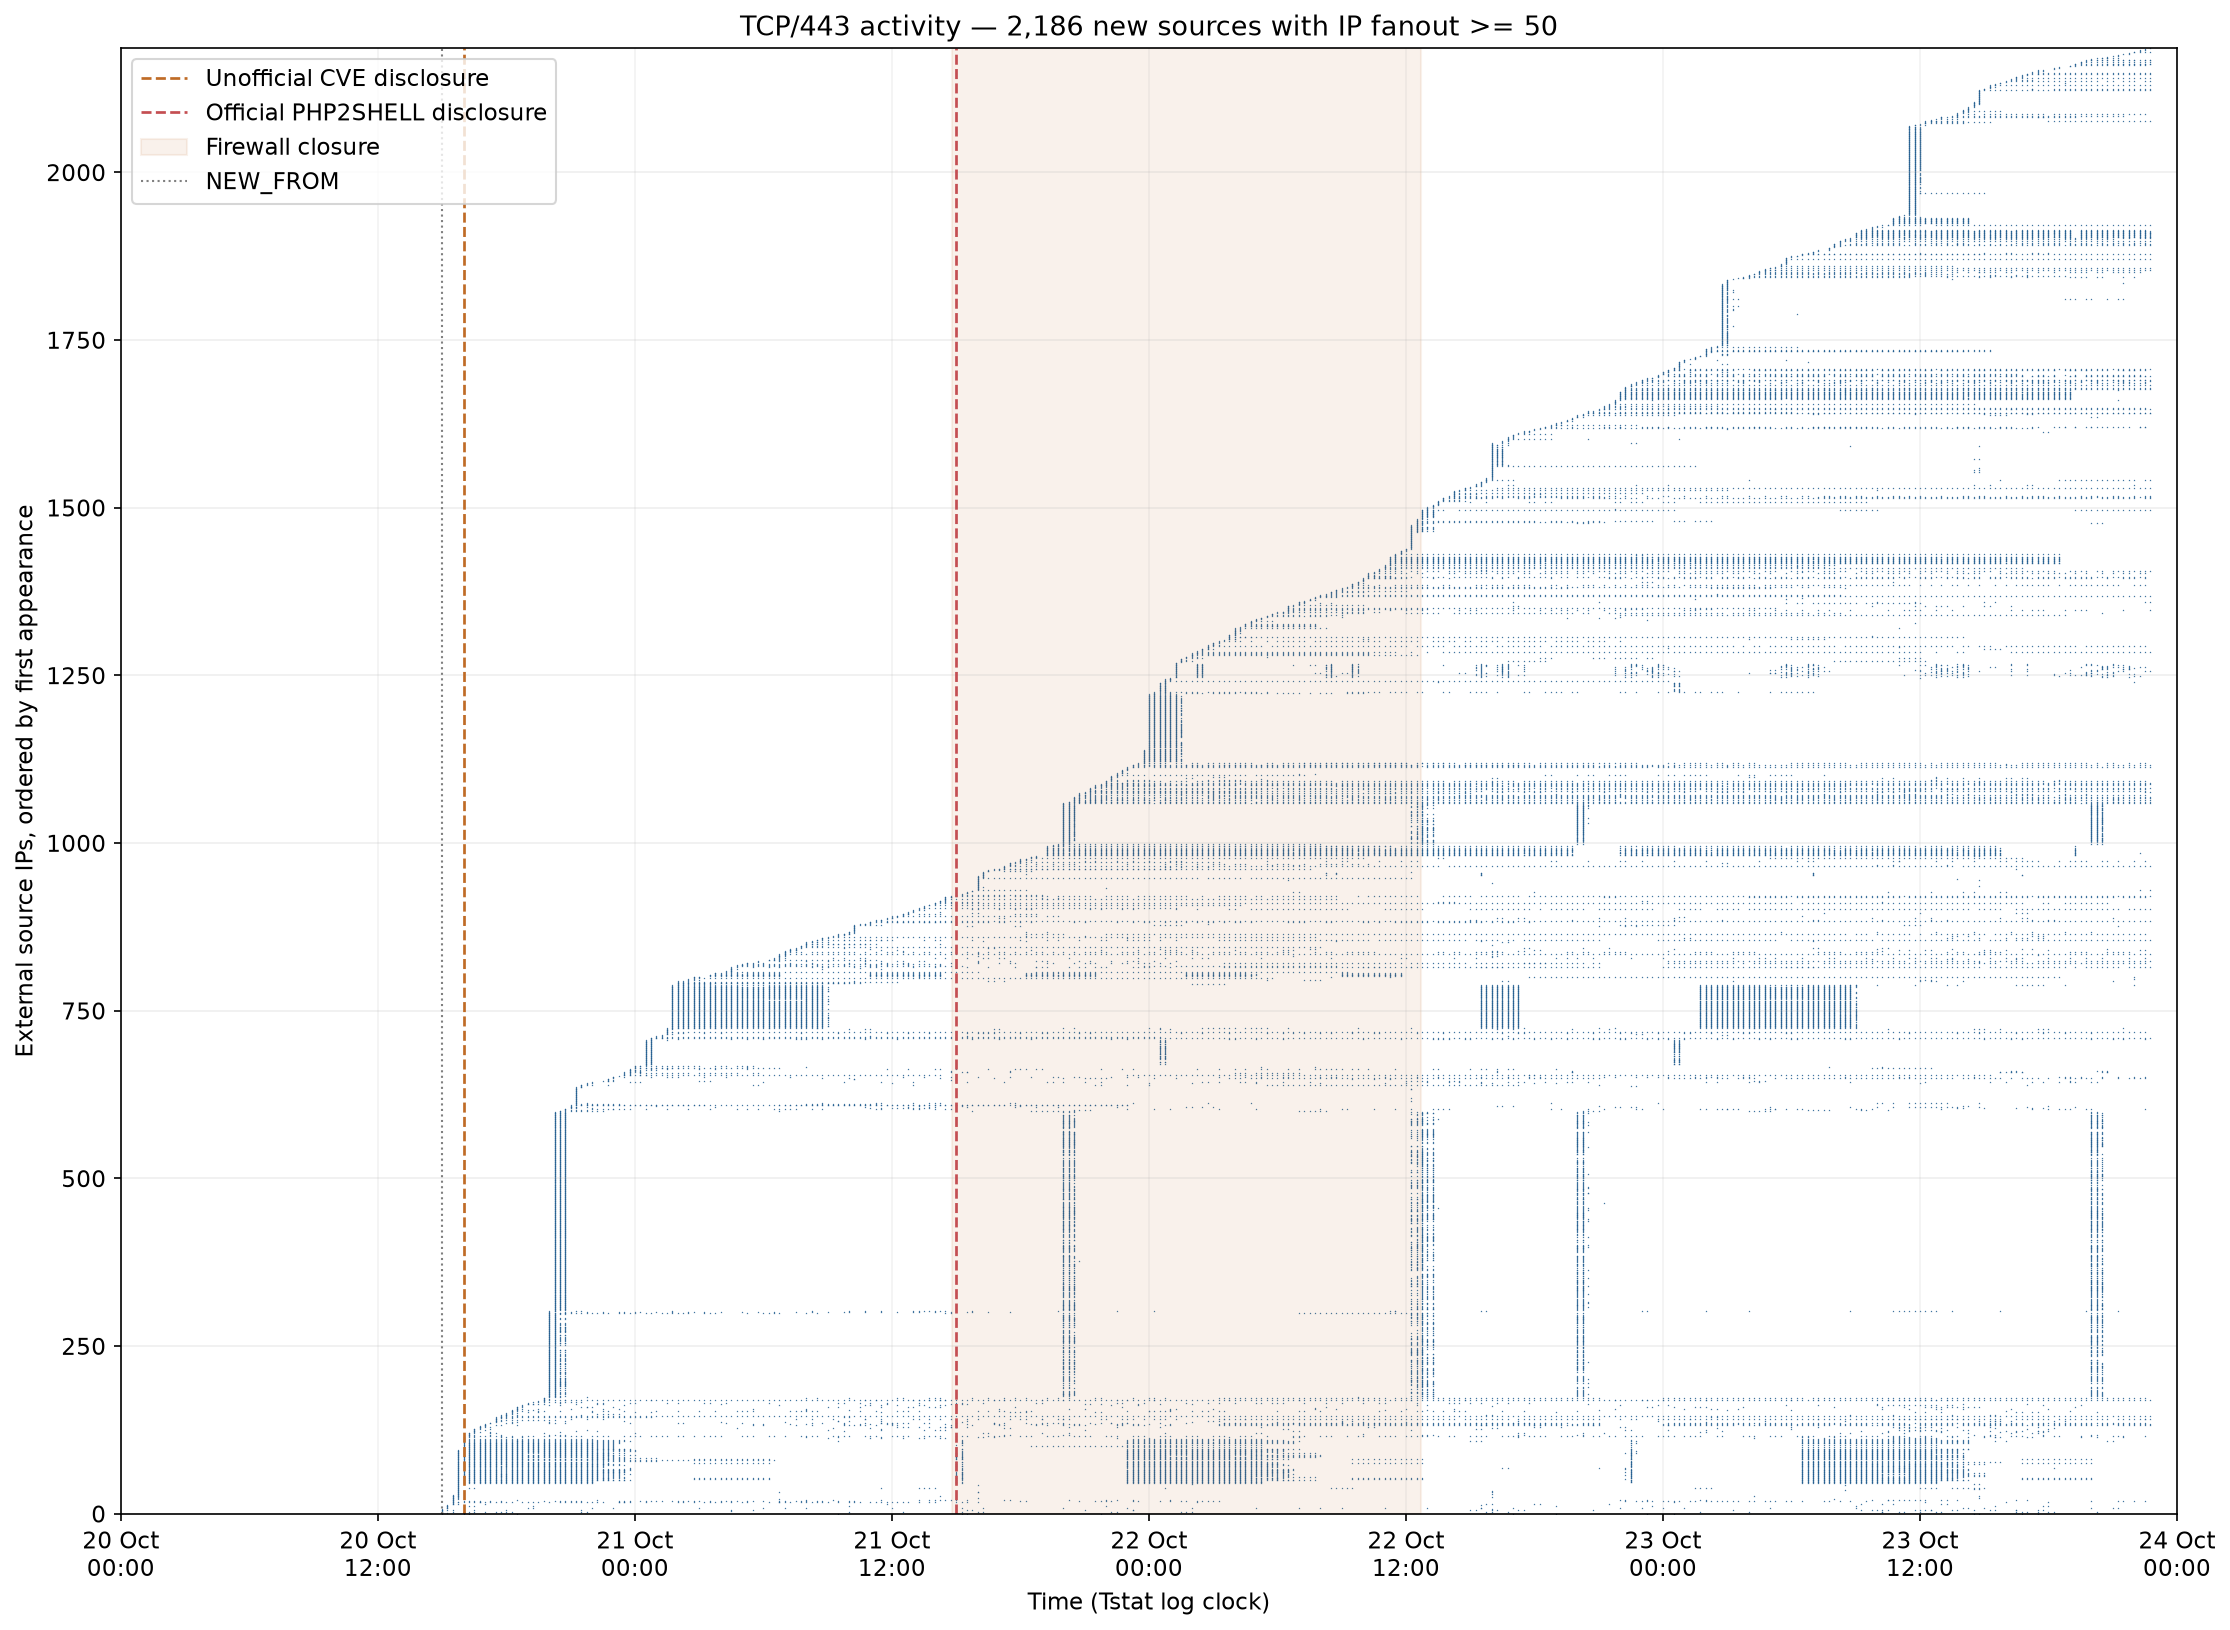
Groups appear before and after the official disclosure, and continue emerging throughout the observation period. The raster describes presence and persistence: it does not measure traffic volume or establish that the sources belong to the same operator.
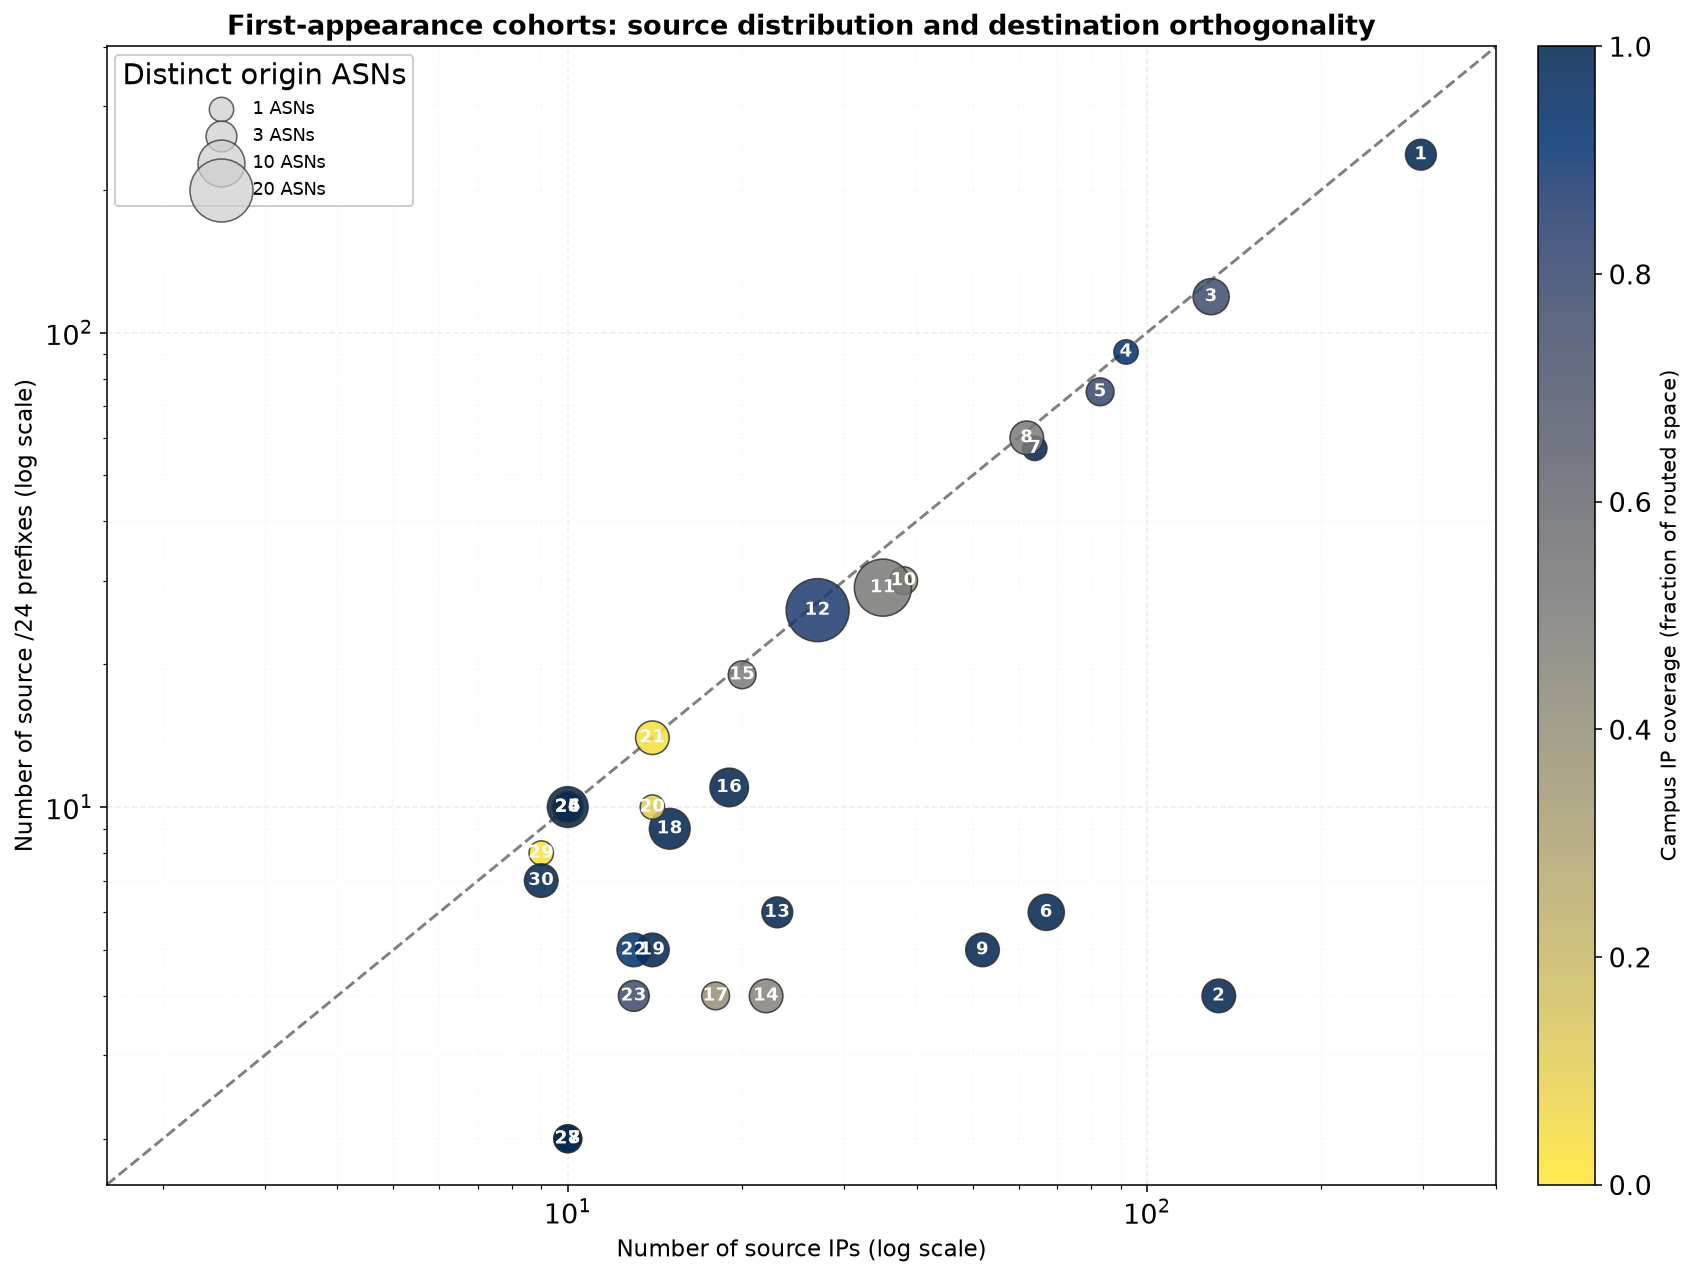
Many /24s can belong to a single AS.
IP counts, address blocks and origin networks describe different aspects of the same population.
A group may spread its sources across many /24 prefixes while remaining entirely within a single Autonomous System. Another may use many adjacent addresses in the same block. Address dispersion must therefore be considered alongside AS concentration.
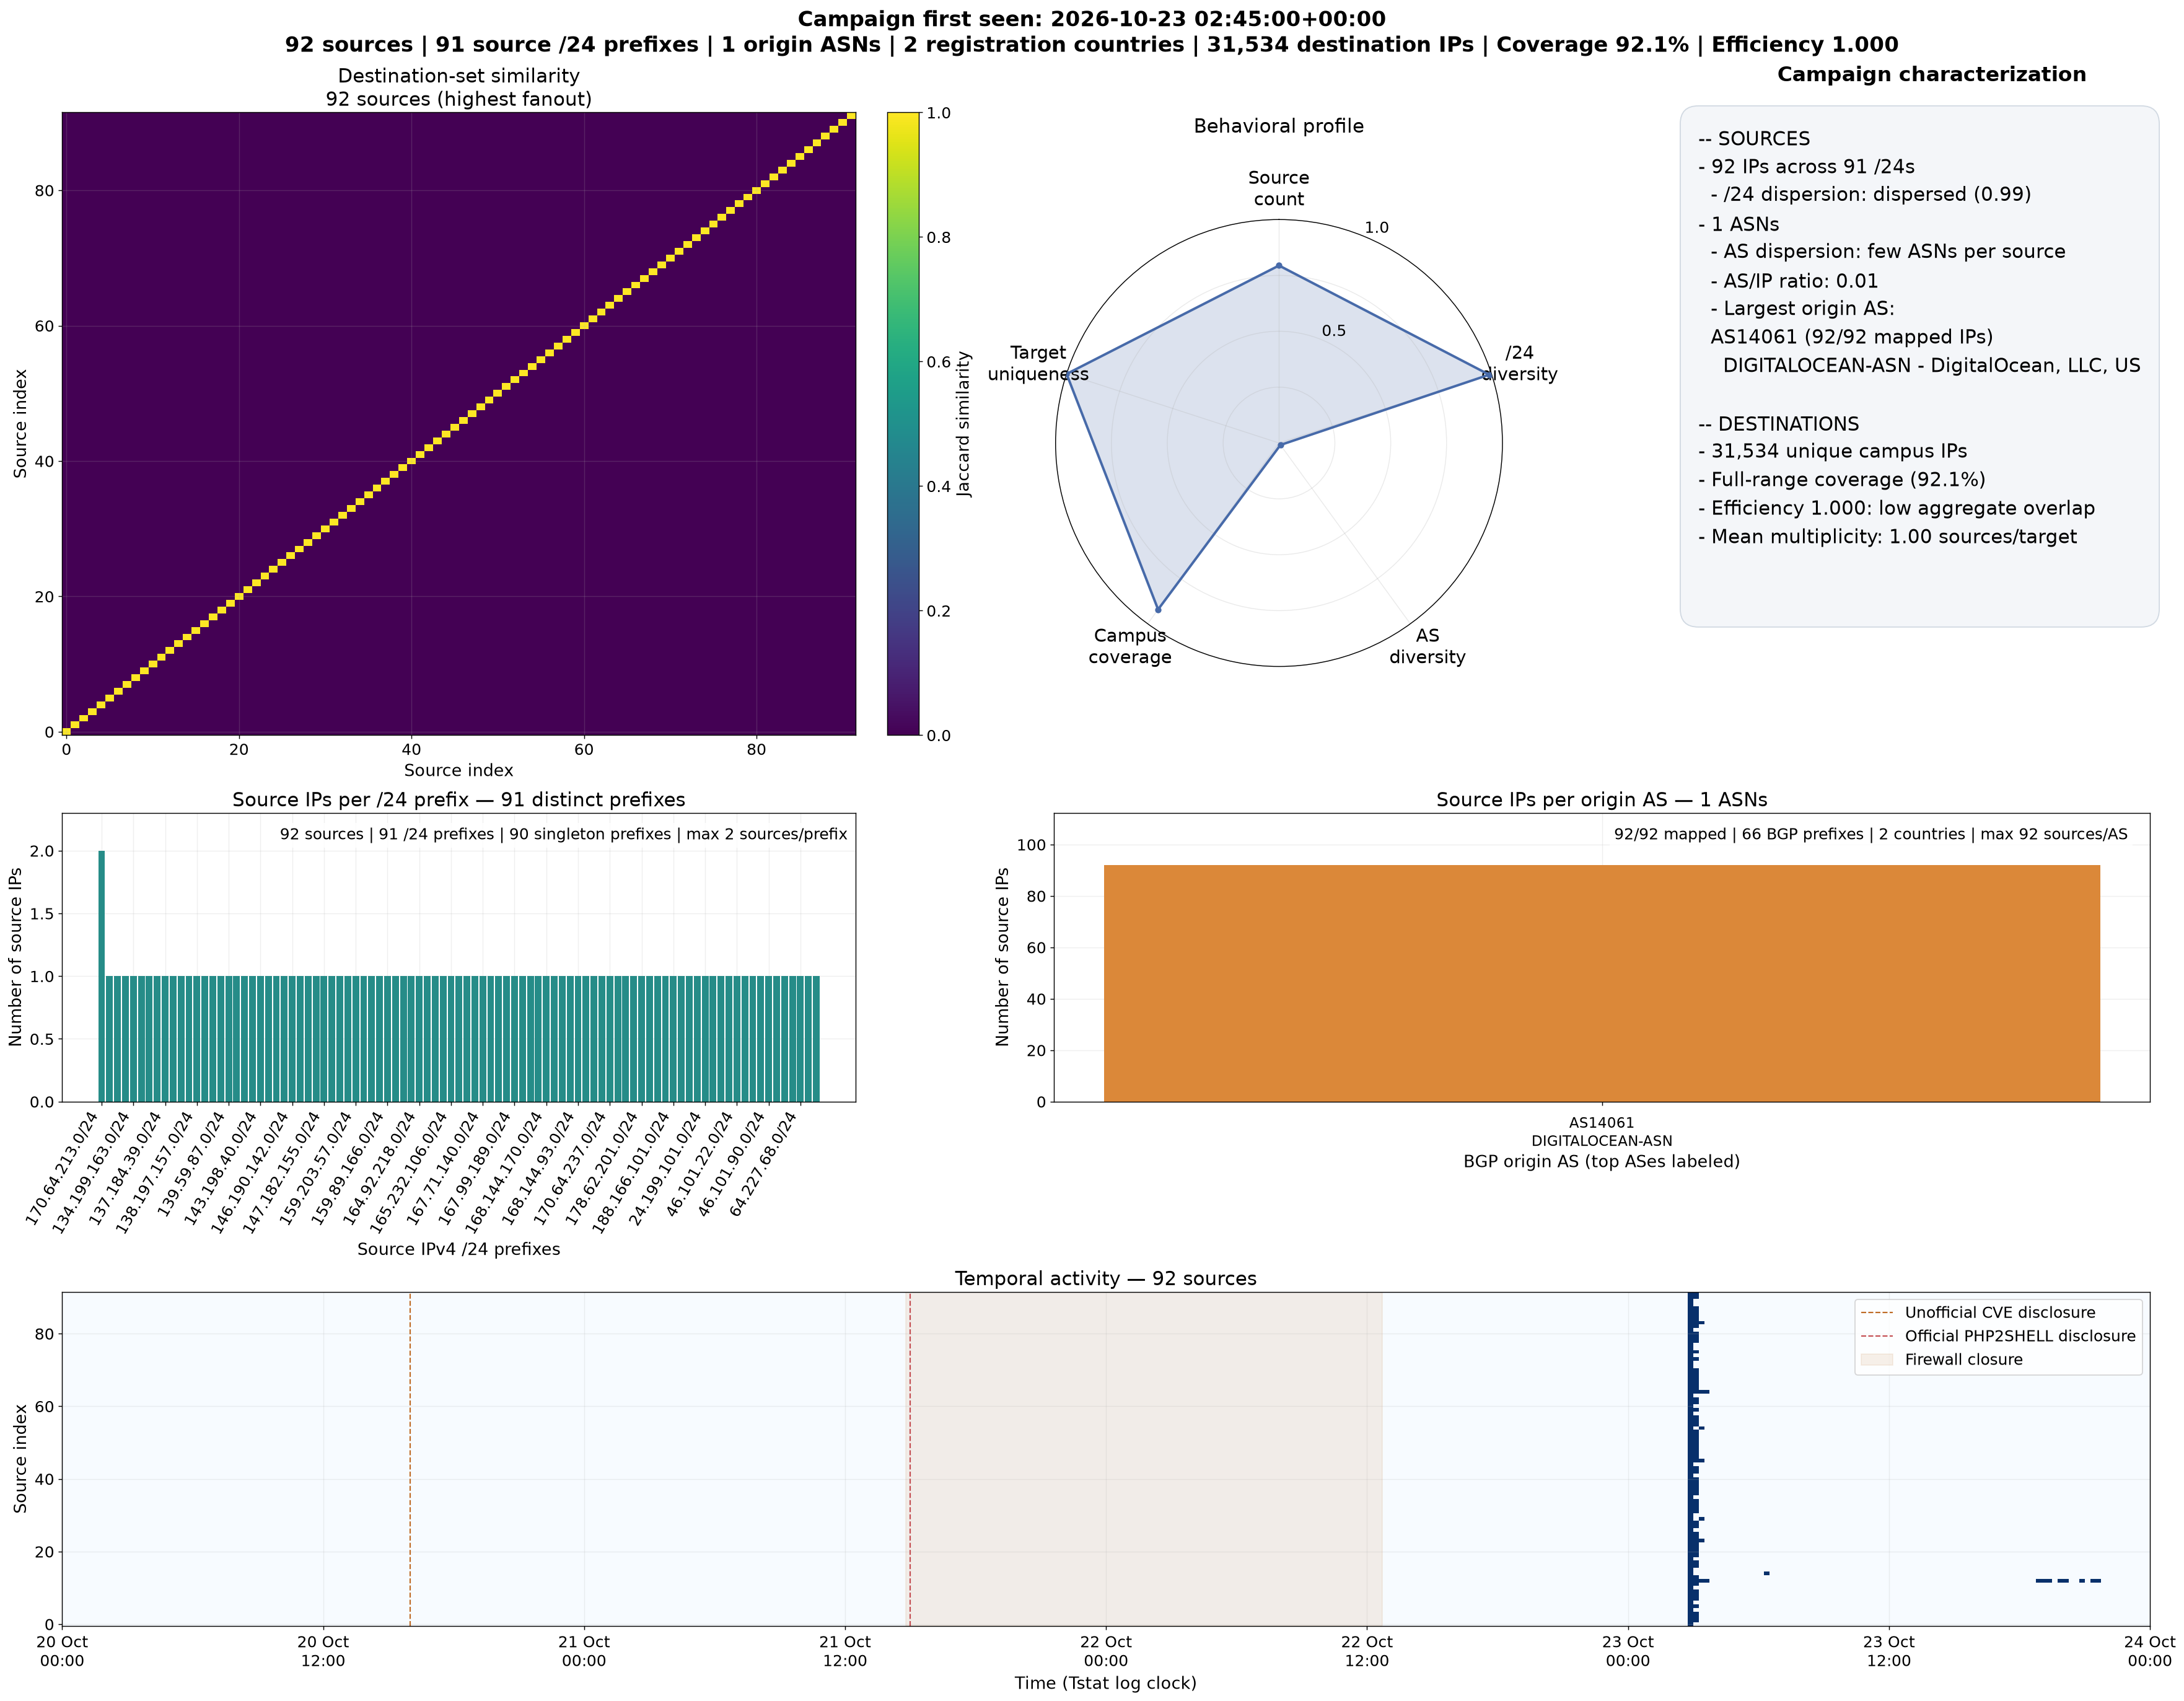
92 sources, 91 /24s, a single AS.
Cohort 4, first observed at 02:45 on 23 October, is widely dispersed across prefixes but concentrated in one origin network, identified in the cache as DigitalOcean.
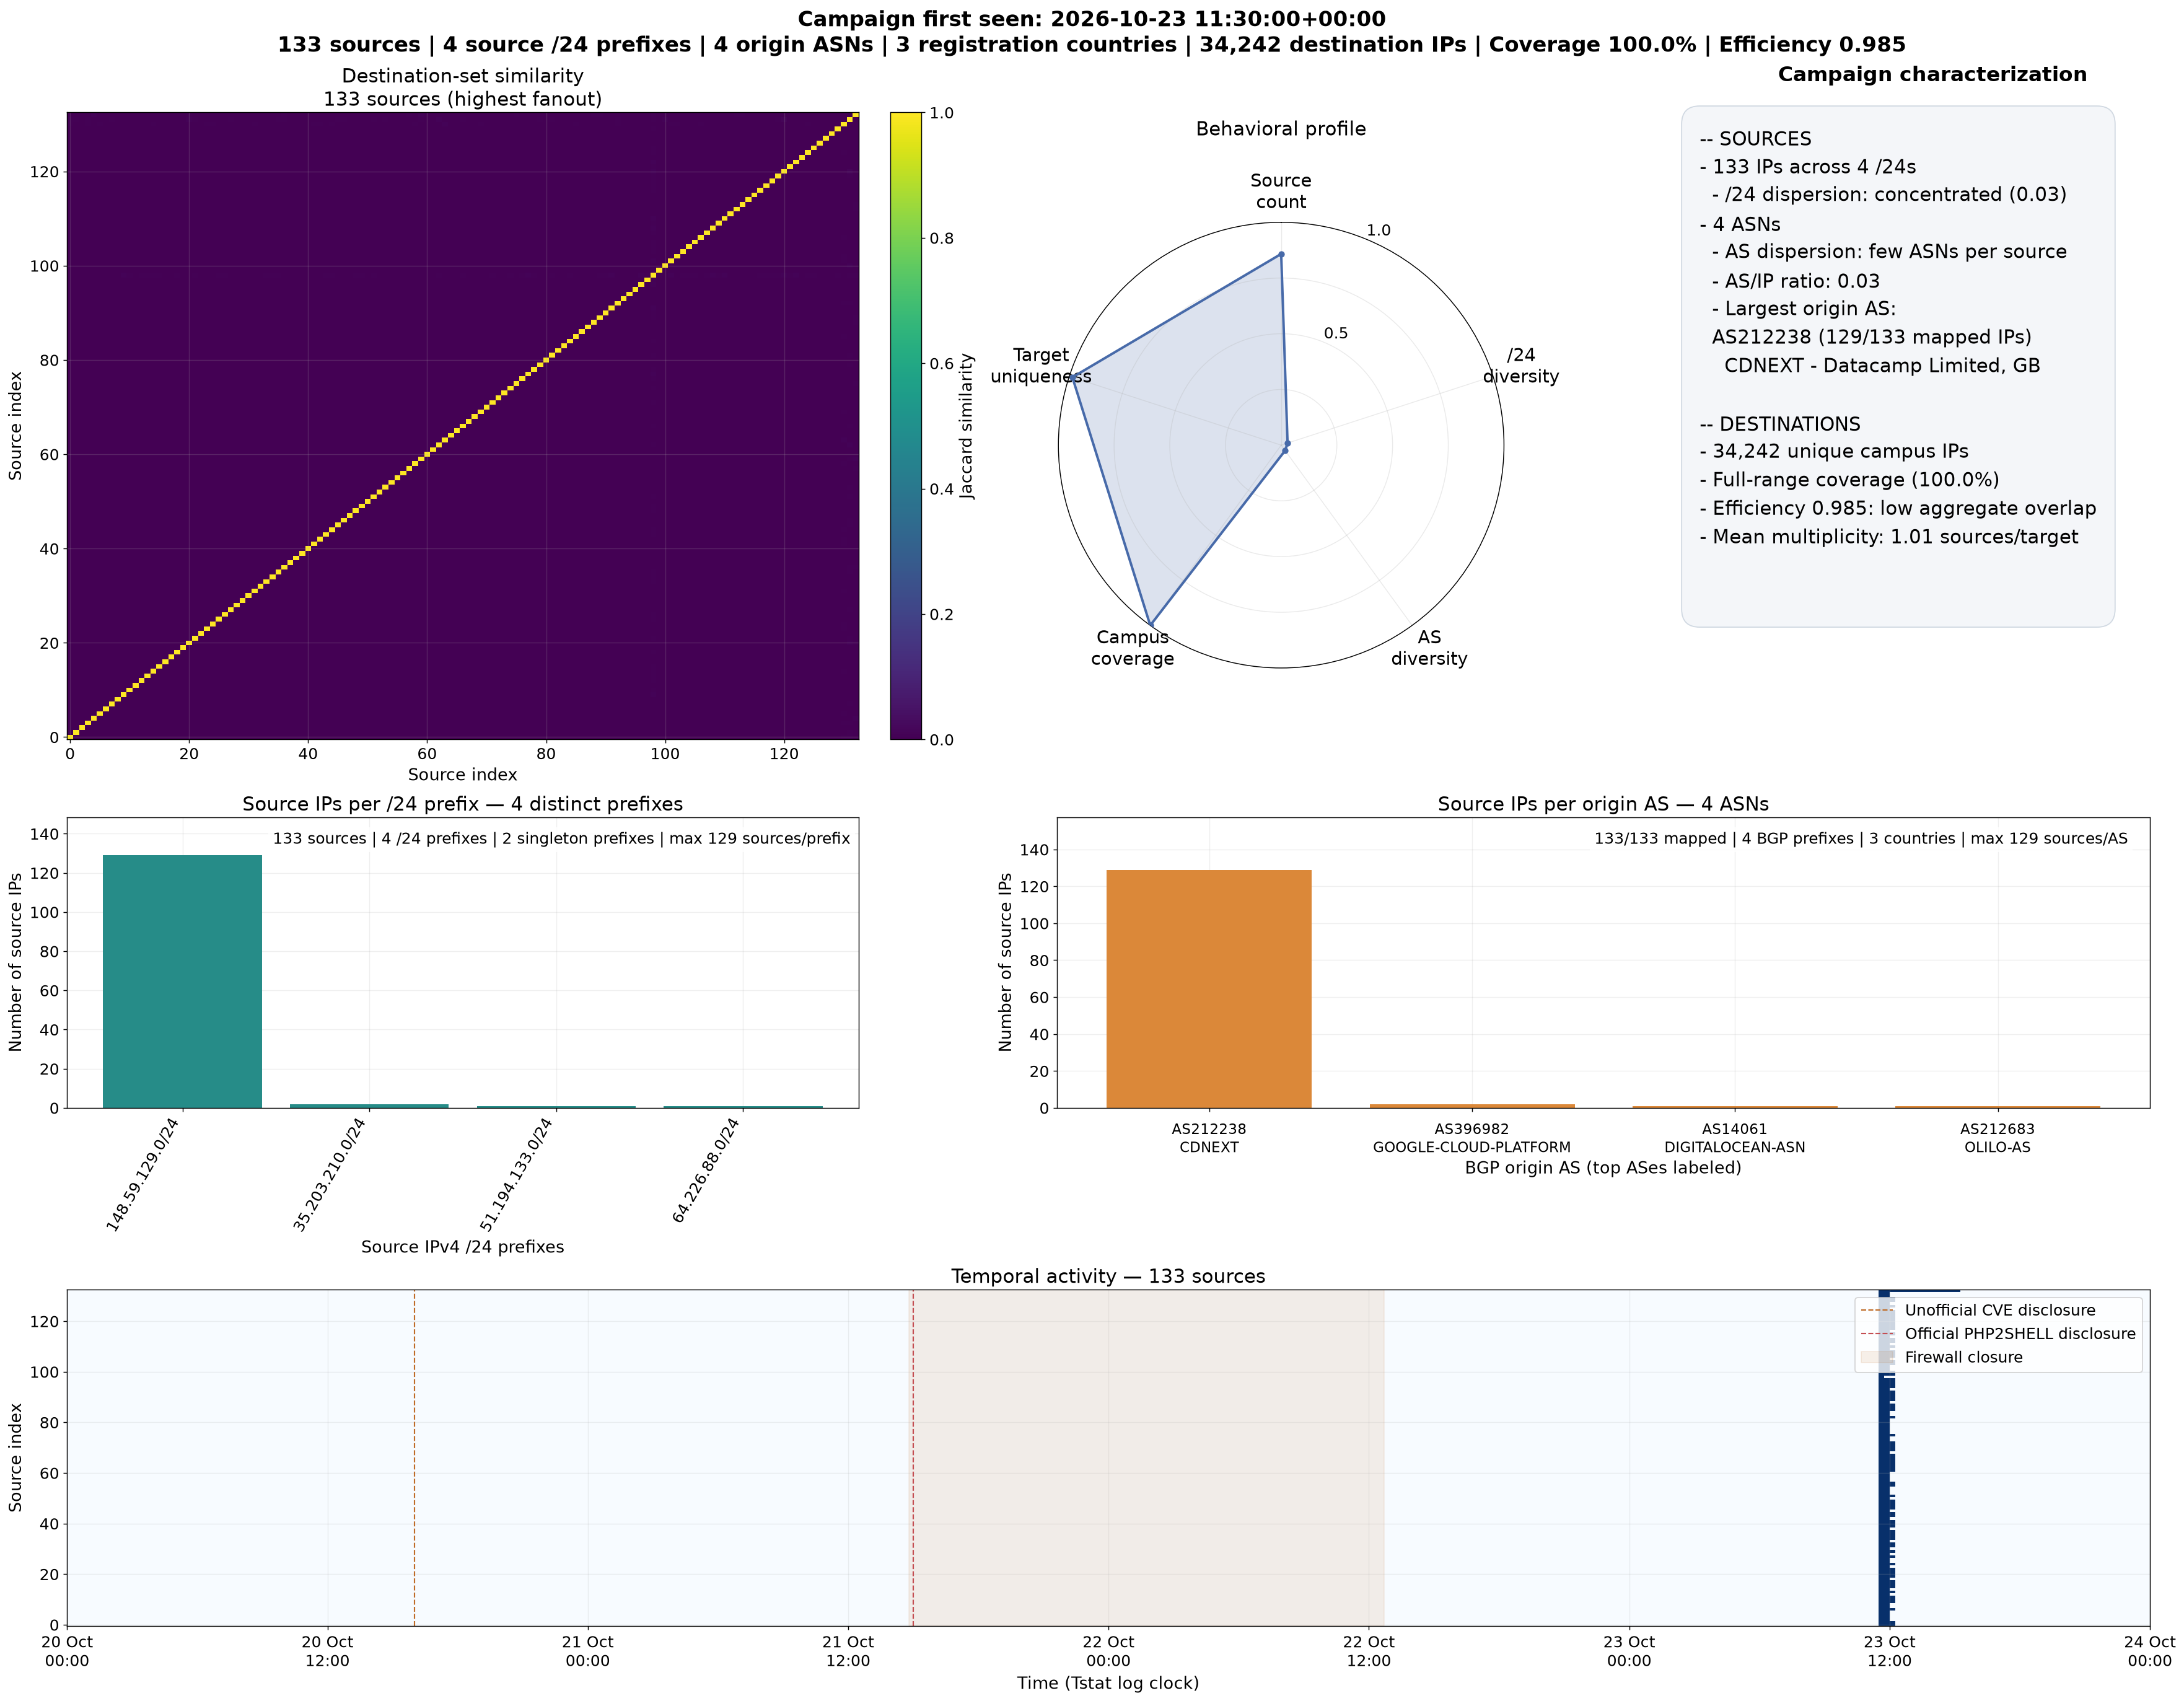
133 sources, just four /24s.
Cohort 2, first observed at 11:30 on 23 October, is also concentrated in address space: 129 sources share the same /24 and the dominant AS, identified in the cache as Datacamp.
The AS identifies the addresses’ origin network, not the provider’s customer or whoever controls the scan. Mappings reflect information available at lookup time, not a historical routing reconstruction.
Do they divide the addresses to scan?
Some cohorts reach almost the entire reference address space with minimal overlap. Others contact the same targets from multiple sources.
The following three cases show different arrangements. When closely timed activity, infrastructure concentration and complementary targets agree, they provide evidence consistent with coordinated distributed scanning.
92 IPs · many /24s
Nearly disjoint targets, sources in the same AS.
The group first observed at 02:45 on 23 October comprises 92 sources across 91 /24s, all within the same AS. Together they contact 31,534 internal addresses, approximately 92.1% of the reference space, with efficiency close to 1. This is one of the clearest cases of complementary targets.
133 IPs · few /24s
Almost the whole campus, from concentrated infrastructure.
The group first observed at 11:30 on 23 October comprises 133 sources across four /24s and four ASes. Of these, 129 are concentrated in the same /24 and dominant AS. Coverage reaches 34,242 destinations and efficiency is 0.985: overall overlap is very low.
297 IPs · overlapping targets
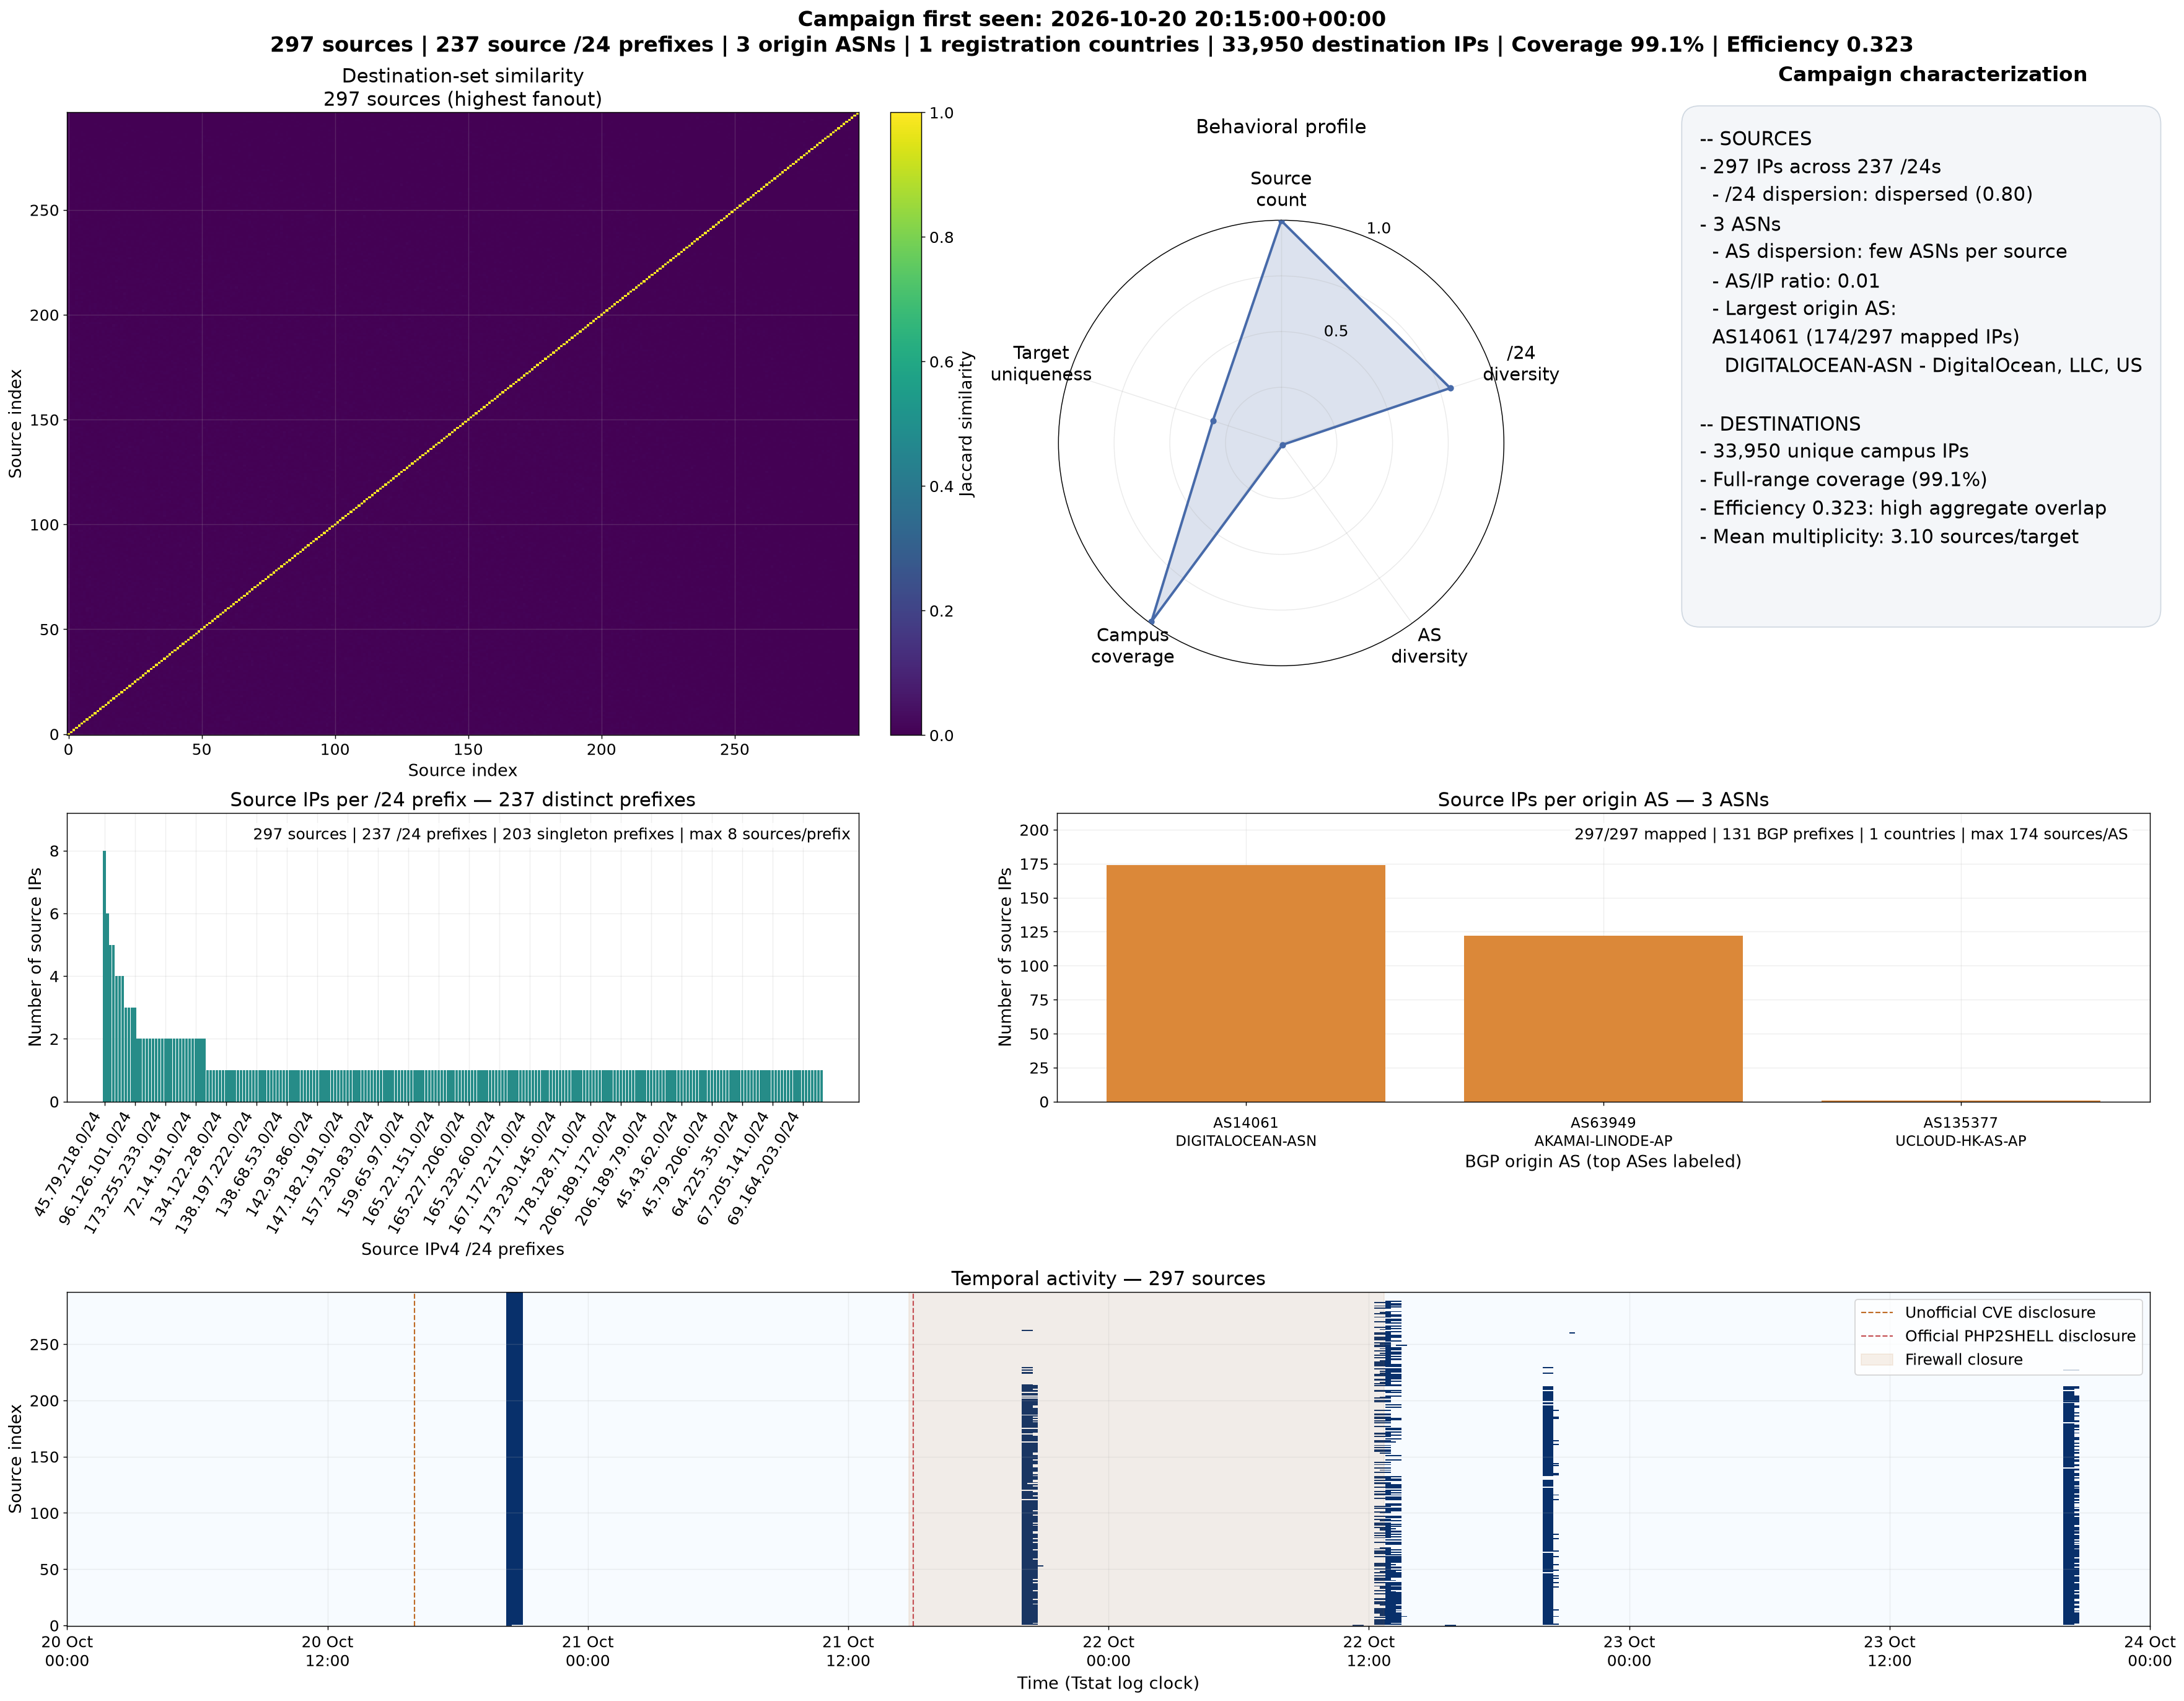
The largest group is not the most orthogonal.
The cohort first observed at 20:15 on 20 October contains 297 sources across 237 /24s and three ASes. It contacts 33,950 destinations, approximately 99.1% of the reference space. Efficiency falls to 0.323: each target is contacted by about 3.1 different sources on average.
How do we measure overlap and orthogonality?
For each source IP, we build the set of internal addresses contacted during the observation period. A destination is counted once per source, even if that source contacts it repeatedly.
Efficiency = distinct destinations of the group ÷ sum of each source’s distinct destinations
A value of 1 indicates disjoint sets. The reciprocal of efficiency is the mean number of sources contacting a destination.
Jaccard similarity compares two sources at a time: the intersection of their targets divided by their union. Low values may also occur for small sets drawn from a large space. They must therefore be interpreted alongside aggregate efficiency and the temporal profile, rather than treated as automatic proof of coordination.
Broad, recurring exploration of the network.
The sources keep changing.
New groups appear throughout the observation period. Their targets cover large portions, and in several cases almost all, of the reference address space.
Some groups divide the targets.
Cohorts with minimal overlap show an arrangement consistent with distributed work. Dispersion across many /24s can coexist with strong concentration in a few ASes.
A link to PHP2SHELL has not been established.
The time markers provide context. They are insufficient to link the campaigns to the vulnerability, and the available data do not show a specific response clearly attributable to disclosure.
The observed behaviour is predominantly horizontal scanning on port 443: many internal addresses are explored, with no evidence here of a focus exclusively on PHP servers.
This analysis does not identify targeted, or “vertical”, application-level attacks against PHP2SHELL. Nor does it establish their absence: the data describe connections and targets, and many attempts do not reach the application layer.
Before and after the unofficial disclosure
The initial analysis compares two 16-hour windows around the unofficial marker at 16:00 on 20 October. Using a threshold of at least 10 destination IPs or 10 SNIs, the proportion of high-fanout sources changes from 1.55% to 1.17%.
This metric does not support a general increase in this comparison. It uses a different threshold and population from the detailed analysis of 2,186 sources with at least 50 destinations. The windows have equal duration but cover different times of day: this is not a byte-volume measure or a test around the official disclosure.
A recurring presence.
An organisation to characterise.
The most defensible interpretation is recurring background scanning, with some groups showing strongly complementary targets. Common ownership, intent and exploitation of the vulnerability remain separate from what these data establish.
Comparing the thirty cohorts.
Cohorts group sources first observed within the same 15-minute interval. Their numbers match the bubbles and the three cases shown.
Dates and times follow the Tstat clock.
| Cohort | First observation | Source IPs | /24 | AS | Destinations | Coverage | Efficiency |
|---|---|---|---|---|---|---|---|
| 1 | 297 | 237 | 3 | 33950 | 99.1% | 0.323 | |
| 2 | 133 | 4 | 4 | 34242 | 100.0% | 0.985 | |
| 3 | 129 | 119 | 5 | 26246 | 76.6% | 0.611 | |
| 4 | 92 | 91 | 1 | 31534 | 92.1% | 1.000 | |
| 5 | 83 | 75 | 2 | 27050 | 79.0% | 0.993 | |
| 6 | 67 | 6 | 5 | 34251 | 100.0% | 0.288 | |
| 7 | 64 | 57 | 1 | 34251 | 100.0% | 0.333 | |
| 8 | 62 | 60 | 4 | 17522 | 51.2% | 0.775 | |
| 9 | 52 | 5 | 4 | 34249 | 100.0% | 0.572 | |
| 10 | 38 | 30 | 2 | 13942 | 40.7% | 0.824 | |
| 11 | 35 | 29 | 16 | 17696 | 51.7% | 0.952 | |
| 12 | 27 | 26 | 20 | 29766 | 86.9% | 0.561 | |
| 13 | 23 | 6 | 3 | 34250 | 100.0% | 0.873 | |
| 14 | 22 | 4 | 4 | 16040 | 46.8% | 0.940 | |
| 15 | 20 | 19 | 2 | 17277 | 50.4% | 0.869 | |
| 16 | 19 | 11 | 6 | 34250 | 100.0% | 0.466 | |
| 17 | 18 | 4 | 2 | 13733 | 40.1% | 0.972 | |
| 18 | 15 | 9 | 7 | 34251 | 100.0% | 0.765 | |
| 19 | 14 | 5 | 4 | 34251 | 100.0% | 0.340 | |
| 20 | 14 | 10 | 1 | 4061 | 11.9% | 0.968 | |
| 21 | 14 | 14 | 4 | 1417 | 4.1% | 0.986 | |
| 22 | 13 | 5 | 4 | 31643 | 92.4% | 0.613 | |
| 23 | 13 | 4 | 3 | 26559 | 77.5% | 0.983 | |
| 24 | 10 | 10 | 7 | 34250 | 100.0% | 0.321 | |
| 25 | 10 | 10 | 3 | 20494 | 59.8% | 0.927 | |
| 26 | 10 | 10 | 3 | 34251 | 100.0% | 0.338 | |
| 27 | 10 | 2 | 2 | 30872 | 90.1% | 0.987 | |
| 28 | 10 | 2 | 2 | 34243 | 100.0% | 0.997 | |
| 29 | 9 | 8 | 1 | 903 | 2.6% | 0.983 | |
| 30 | 9 | 7 | 4 | 34199 | 99.9% | 0.974 |
Coverage = distinct destinations divided by 34,250 reference addresses. A value of 100.0% is rounded; some groups have 34,251 observed destinations. Efficiency and coverage retain the precision of the saved outputs. The 30 cohorts shown are not all possible cohorts in the selected population.
Sources and limitations of the analysis
The data source is Tstat, a passive monitoring tool that reconstructs flows and collects traffic statistics on the Politecnico di Torino network. Completed and incomplete connections from external to internal IPs on TCP port 443 are considered. For these attempts, fanout is the number of distinct destinations, not the number of requests or bytes transferred.
The intended capture window runs from 00:00 on 20 October 2026 to 00:00 on 24 October, excluding the final boundary. The last recorded first observation falls at approximately 22:48 on 23 October: the empty tail should not be interpreted as proven absence of scanning. “New” is relative to the available history starting on 20 October.
The actual selection boundary is 15:00 on 20 October on the Tstat clock. The unofficial marker is at 16:00 on 20 October; the official marker is at 15:00 on 21 October. Times retain the alignment already used in the analysis and have not been converted again.
Groups are defined by the 15-minute interval of first observation; proximity at this resolution does not by itself establish a common campaign. For each group, coverage and efficiency use all sources and their activity across the entire observation period. Similarity and temporal matrices can show up to 300 sources per cohort; all 30 cohorts reported here are below this limit.
IP enrichment combines RIPEstat and Team Cymru, preferring the latter where available. The cache contains 2,186 IPs and 2,184 single-AS mappings; comparisons between the services identified three ASN conflicts and three prefix conflicts. ASes reflect routing information available at lookup time and do not identify the campaign operator. Countries shown in the figures are registration information, not verified physical locations.
The figures come from the analysis results; the numerical arrivals chart represents only the 30 cohorts with available summary values. Observed results have been retained without retrospectively restricting the population to another time window. The data cannot attribute these scans to PHP2SHELL or rule out targeted application-level activity.
References on Tstat
- M. Mellia, R. Lo Cigno, F. Neri, Measuring IP and TCP behavior on edge nodes with Tstat, Computer Networks, 47(1), 1–21, 2005.
- A. Finamore, M. Mellia, M. Meo, M. M. Munafò, D. Rossi, Experiences of Internet Traffic Monitoring with Tstat, IEEE Network, 25(3), 8–14, 2011.