

The Microsoft 365 incident of 12–13 November 2026 left a clear transport-level signature in traffic observed at Politecnico di Torino: a sharp increase in incomplete TCP flows, more UDP flows without an observed reply, and pronounced RTT and reset anomalies for Exchange / Outlook.
In individual five-minute bins, the incomplete TCP share reached 95.8% within the monitored M365 address ranges, while the UDP no-response share reached 72.8% in a separate, non-DNS candidate population. For Exchange / Outlook, the median of per-flow mean RTTs peaked at 278 ms, and the 95th percentile at 5.26 s. These maxima occur in different bins and refer to different populations; they are not estimates of a common application failure rate.
We examine flow records collected using Tstat (TCP STatistic and Analysis Tool), a passive network measurement tool developed at Politecnico di Torino. Tstat reconstructs bidirectional flows and records transport statistics and observable protocol metadata. This study uses its flow-level logs, with downstream aggregation performed by our analysis scripts. The observation window starts at 12:00 CET on 11 November. This provides a baseline before the reported incident and captures the subsequent deterioration and recovery. The shaded interval in every figure is an external incident reference, rather than an estimate of when every local user experienced disruption.
TCP flows become predominantly incomplete
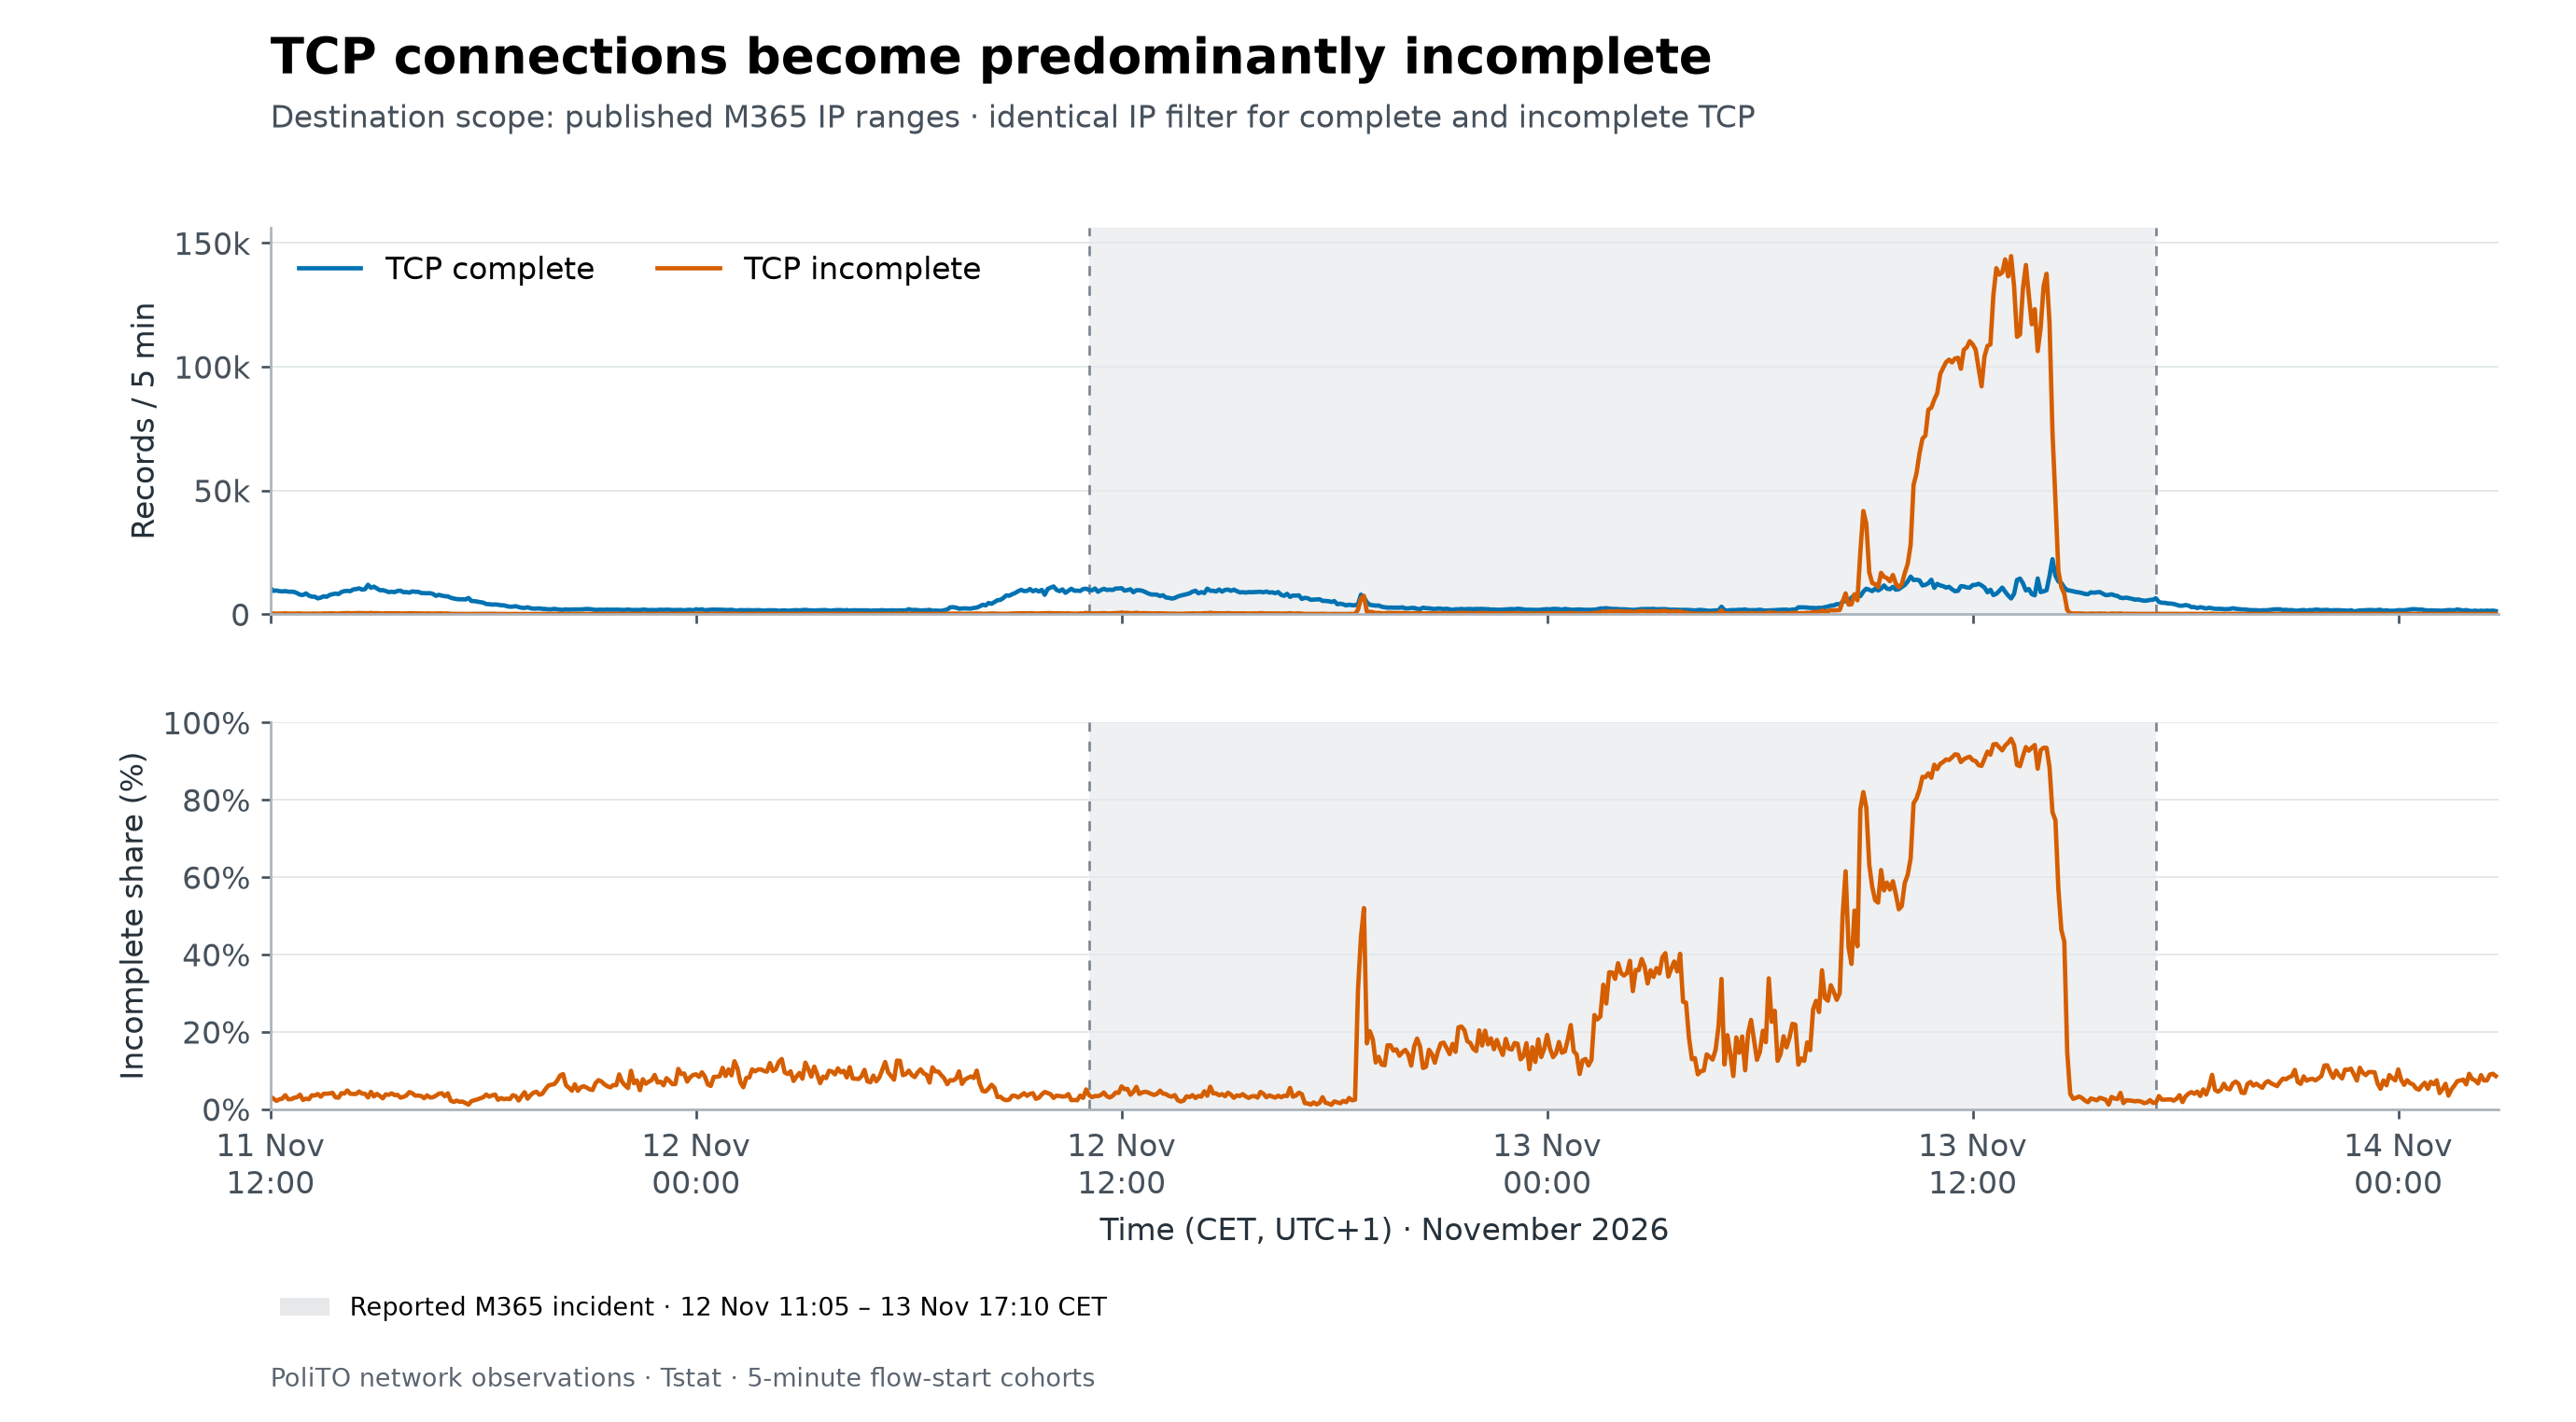
The first signature is a substantial change in the balance between complete and incomplete TCP records. To make the two populations comparable, both are selected using the same published M365 destination IP ranges. The incomplete share is computed as incomplete records divided by the sum of complete and incomplete records in each bin.
The share rises sharply on the evening of 12 November, remains elevated through several phases, and approaches 96% during the early afternoon of 13 November. It then falls rapidly. The count panel shows the underlying traffic volumes alongside this proportion, helping distinguish a change in share from a change in the number of observed records.
UDP anomalies also appear before the reported incident
For non-DNS UDP candidates, we count records with no observed server packets. Their share is initially low, but develops a repeated oscillatory pattern on the evening of 11 November, before the shaded interval. A larger and more persistent increase follows on the evening of 12 November, with a peak of approximately 73% on 13 November.
The earlier oscillations are worth documenting separately. Their temporal position does not establish that they were a precursor to the same incident. UDP applications may legitimately send one-way traffic, and loss or incomplete visibility at the observation point can also produce records without replies. This metric therefore describes an observed traffic asymmetry rather than a verified failure probability.

The strongest RTT deterioration affects Exchange / Outlook
Service-level TCP diagnostics reveal a more selective effect. Exchange / Outlook exhibits a sustained RTT increase on the evening of 12 November and much larger excursions on the morning of 13 November. The median reaches approximately 278 ms; the 95th percentile reaches 5.26 s. The other service groups do not show a sustained increase of comparable magnitude in their median RTTs.
Each statistic is calculated across the mean RTT of each flow, using records with valid client-side RTT samples. It is neither an application response time nor a percentile of all packet-level RTT samples. The comparison also concerns flows for which RTT can be measured: connections that yield no valid samples are absent. Increased RTT is consistent with transport-level degradation, but these measurements alone cannot locate queueing or establish congestion as the cause.

Server-direction TCP resets rise during the degradation
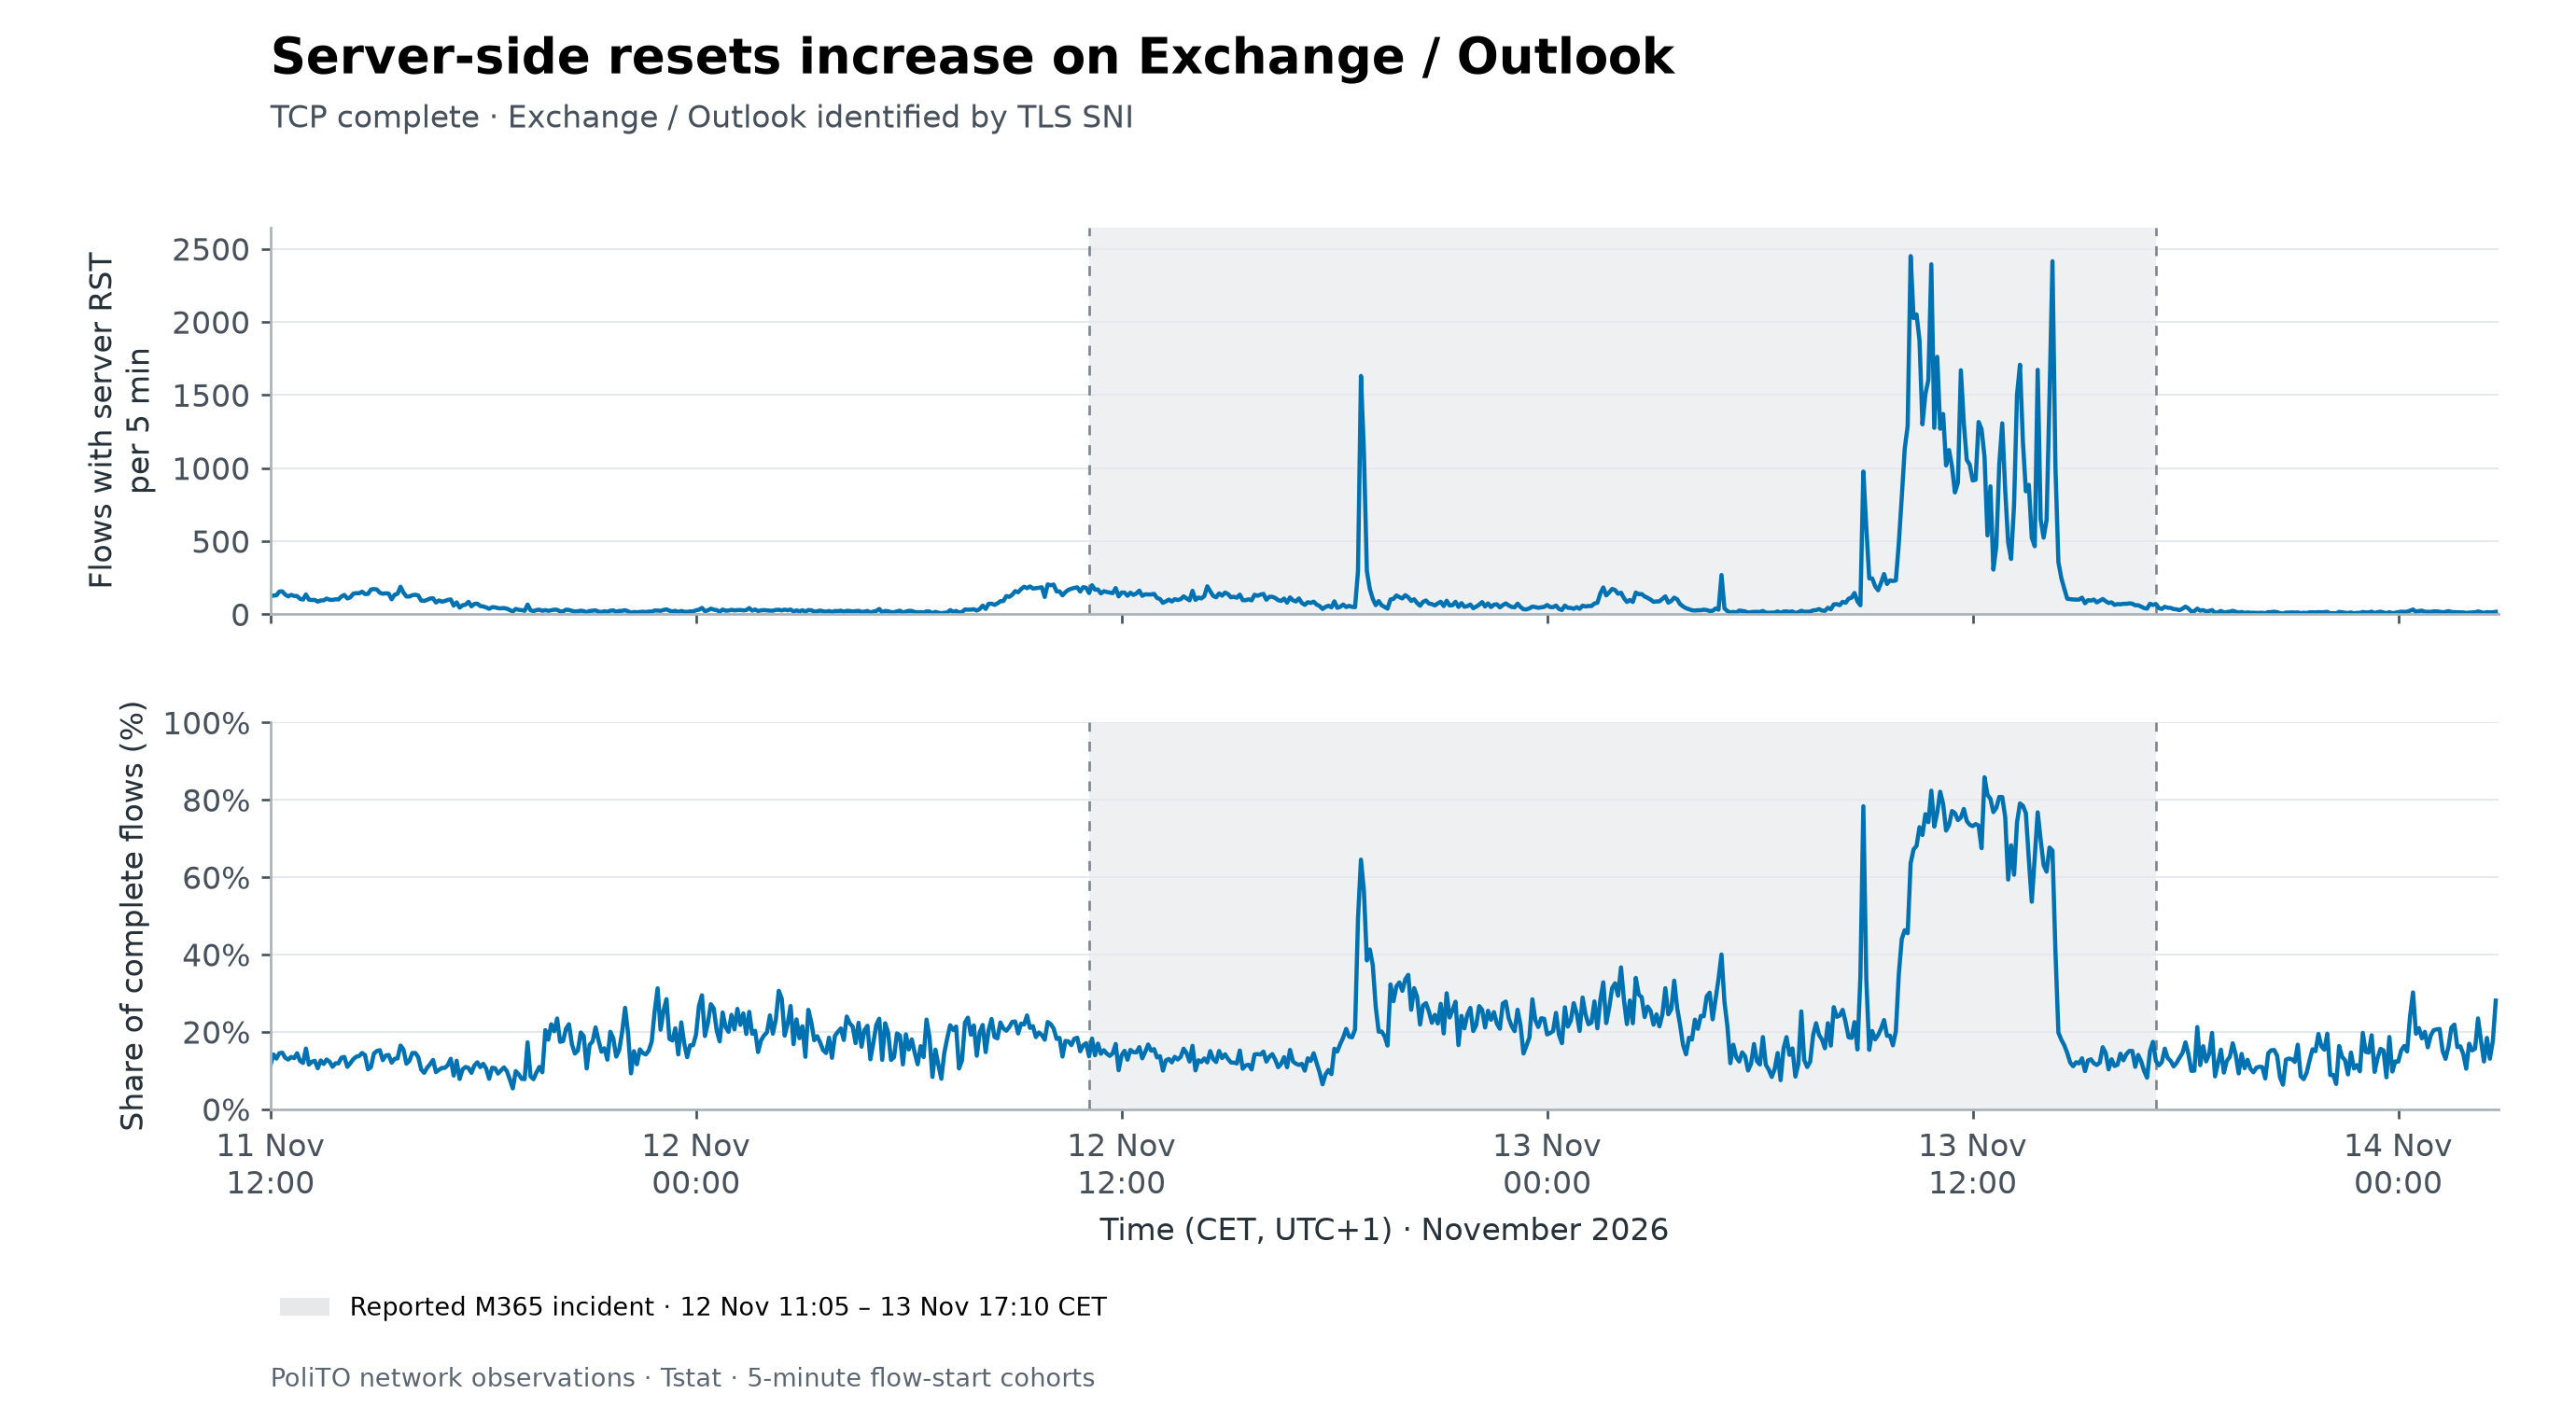
The Exchange / Outlook records also show a marked increase in flows containing at least one reset in the server-to-client direction. The count peaks at 2,450 flows in a five-minute bin; in a different bin, the share reaches 85.8% of the service’s complete TCP records. Both metrics fall sharply after the most severe phase.
This provides evidence of active connection termination in addition to incomplete flows and elevated RTT. It supports investigating the service-facing connection path, but reset direction does not uniquely identify the device that generated the packet: a server, load balancer, firewall, or another intermediary may be involved. A flow with a reset is counted once, irrespective of its number of RST packets.
A local view of a wider service incident
The simultaneous changes in TCP completeness, UDP response visibility, Exchange / Outlook RTT, and reset incidence provide complementary evidence of substantial transport-level disruption at this observation point. Their magnitudes and timing differ, and recovery in these metrics precedes the end of the external incident reference.
Microsoft’s incident communications, reproduced in the University of Pennsylvania incident archive (MO1550821), associate the disruption with connection establishment for Exchange Online and describe effects on Exchange-dependent features across M365. The selective RTT deterioration observed here is compatible with that account. The passive measurements do not independently verify Microsoft’s root-cause explanation or quantify impact across all customers.
Measurement scope and interpretation
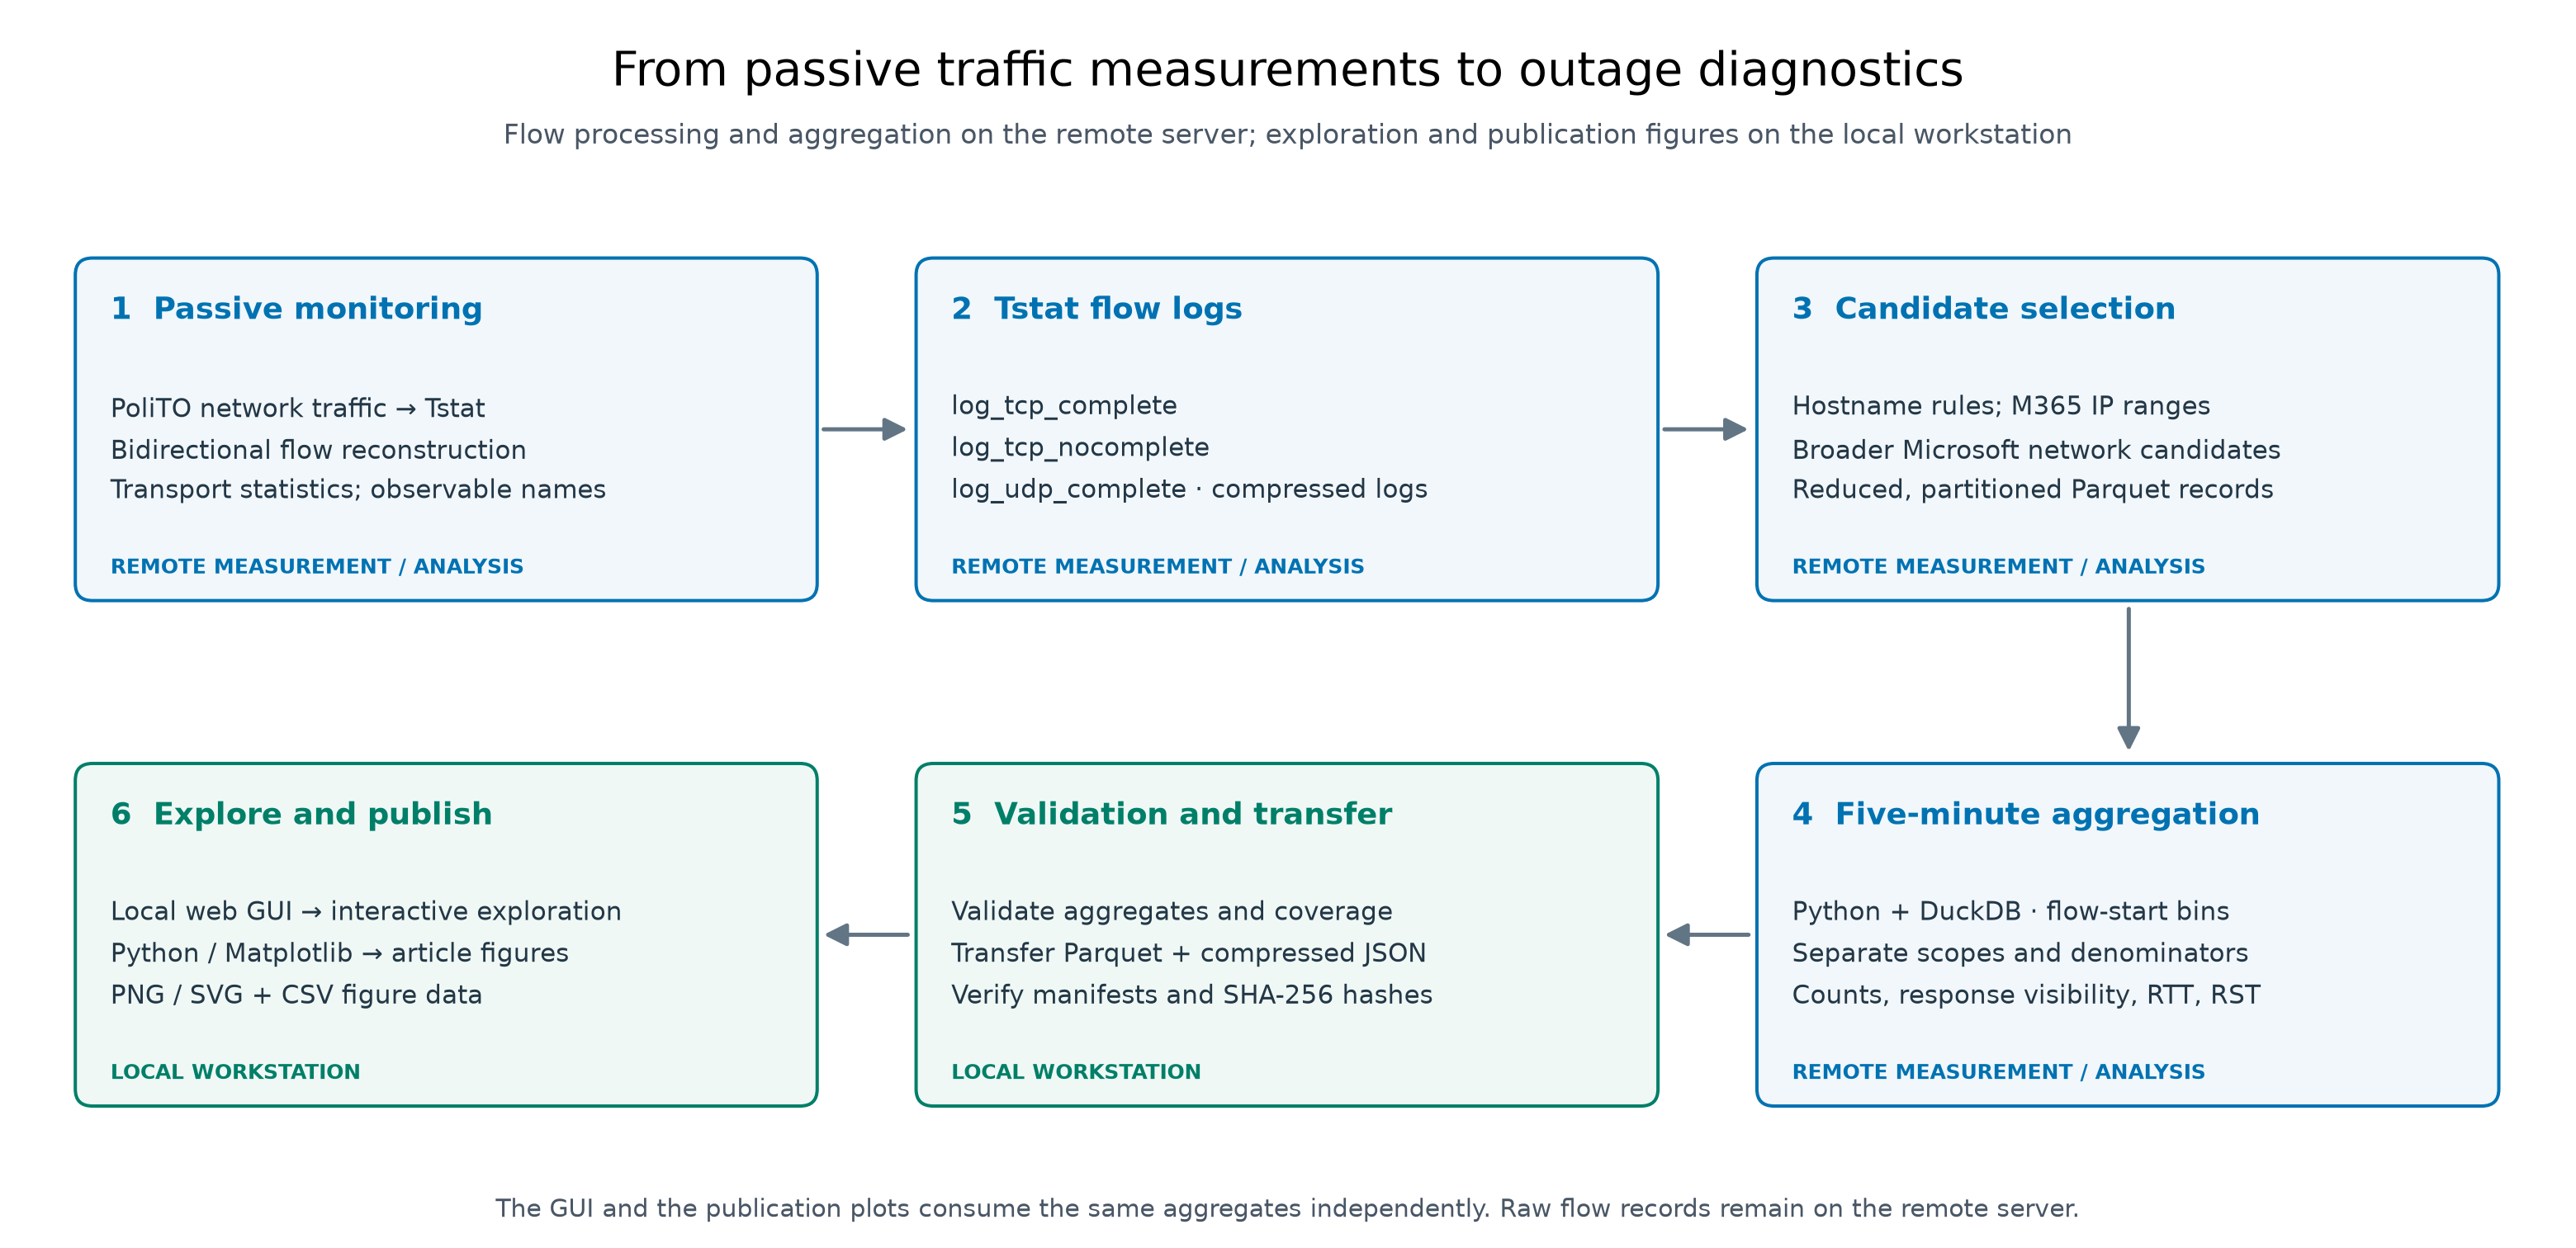
The processing pipeline separates remote flow analysis from local exploration. Compressed Tstat logs are filtered into a reduced Parquet dataset using hostname rules and IP-based candidate selection. Python and DuckDB compute five-minute aggregates with explicit traffic scopes. The aggregates are validated, transferred to the local workstation, and checked against manifests and hashes. The local GUI and the Python / Matplotlib publication scripts then read the same aggregates independently; the article figures do not depend on the GUI.
- Time and aggregation. Each record is assigned to a five-minute bin using its first-packet timestamp. Counts describe observed flow records, not HTTP requests, user sessions, or concurrent connections. The analysis ends at 02:50 CET on 14 November, exclusively; the final partial bin is omitted. Flows still open at the capture boundary may be missing from completed-flow records.
- Traffic selection. Figures 1–4 use explicitly different populations: common M365 IP ranges for the TCP completeness comparison; non-DNS UDP candidates for response visibility; and hostname-attributed complete TCP records for service RTT and resets. The selection is not limited to TCP port 443. IP-based attribution can include shared infrastructure, while hostname attribution requires an observable name.
- Collection discontinuity. A gap and subsequent reduction in recorded flow counts on the morning of 11 November also appeared in a quick check of Google traffic. We treat this as an unrelated data artifact and exclude the affected period by starting at noon. Its precise collection-side mechanism has not been established.
- External incident interval. Shading follows the incident card’s Start Time and End Time: 12 November 10:05 UTC to 13 November 16:10 UTC, corresponding to 11:05 CET and 17:10 CET. The final narrative in the same archive instead gives 12 November 16:20 UTC as the start. This inconsistency is retained explicitly; the band is contextual and does not define the locally measured impact interval.
The figures describe the traffic visible at one measurement point. Transport anomalies establish a change in observed network behaviour; they do not, on their own, identify an application failure, the responsible infrastructure component, or the experience of every user.