
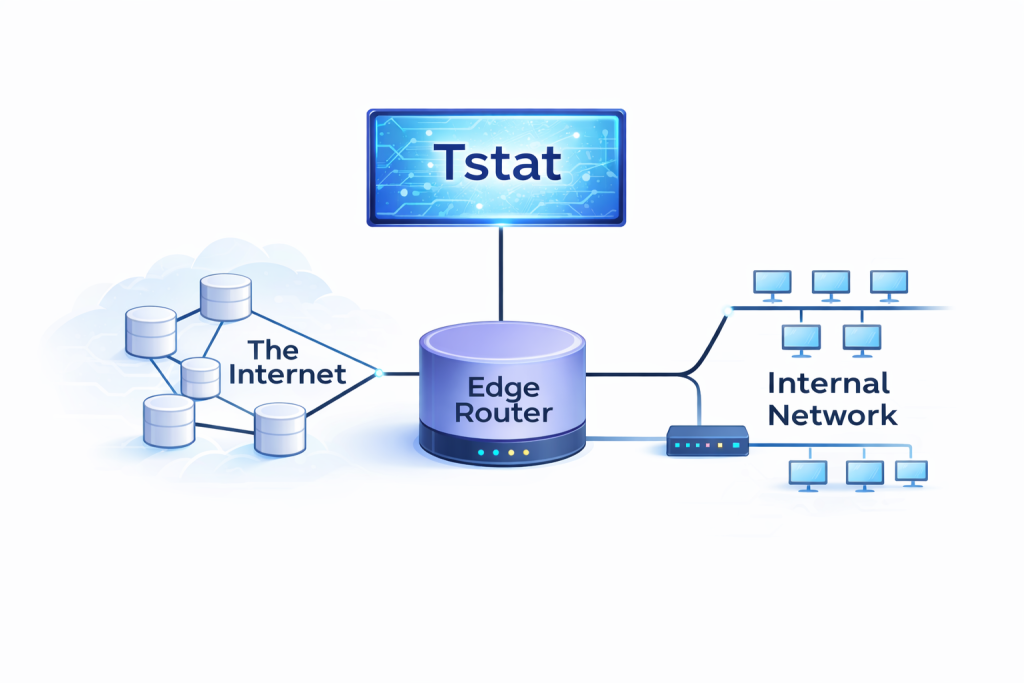
Tstat is a passive sniffer able to provide several insights into the traffic patterns at both the network and transport levels.
The software and its documentation are available on GitHub at: https://github.com/Tstat-TCP-STatistic-and-Analysis-Tool/tstat
Tstat analyzes network traffic and generates three different types of measurement collections:
- Log files store a complete transport-level log of all the measured parameters.
- Round Robin Database stores the distribution of a given quantity during a time interval using the RRD interface.
Traffic Measurements
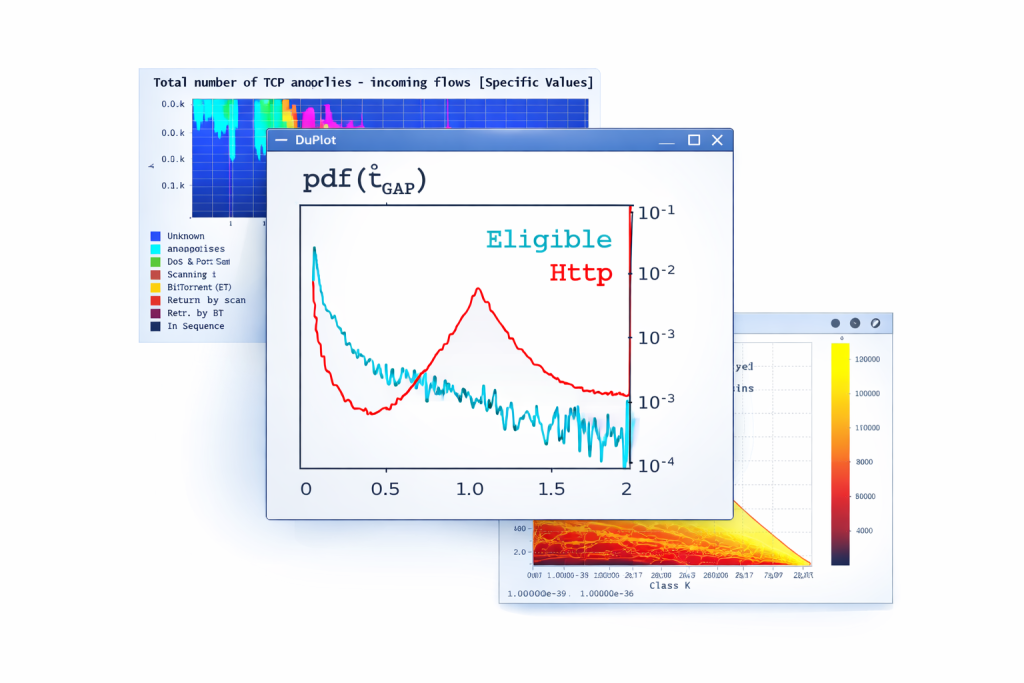
Traffic measurement is an applied networking research methodology aimed at understanding packet traffic on the Internet. From its humble beginnings in LAN-based measurement of network applications and protocols, network measurement research has grown in scope and magnitude, and has helped provide insight into fundamental properties of the Internet, its protocols, and its users. For example, Internet traffic measurement and monitoring serve as the basis for a wide range of IP network operations, management, and engineering tasks such as troubleshooting, accounting and usage profiling, routing weight configuration, load balancing, capacity planning, and so forth.
The lack of automatic tools able to produce statistical data from network packet traces was a major motivation to develop Tstat, a tool that, starting from standard software libraries, offers to network managers and researchers the ability to audit important information about classic and novel performance indexes and statistical data about Internet traffic. Started as an evolution of TCPtrace, Tstat analyzes either real-time captured packet traces, using either common PC hardware or more sophisticated ad-hoc cards such as the DAG cards and Intel NICs. Besides live capture, Tstat can analyze previously recorded packet-level traces, supporting various dump formats, such as the one supported by the libpcap library, and many more. It can capture and process packets at 40+ Gbit/s using the Intel DPDK library.
Assuming that both the forward and backward streams of packets, Tstat can correlate them to infer advanced measurement indexes. For example, if both TCP data and ACK segments can be analyzed, Tstat rebuilds each TCP connection status, looking at the TCP header in the forward and backward packet flows. The bi-directionality of the TCP flow analysis allows the derivation of novel statistics (such as, for example, the congestion window size, out-of-sequence segments, duplicated segments, etc.) which are collected distinguishing both between clients and servers, (i.e., hosts that actively open a connection and hosts that reply to the connection request) and also identifying internal and external hosts (i.e., hosts located inside or outside the measurement point). This methodology has been applied to infer traffic characteristics at the transport layer, and in particular to the TCP and RTP/RTCP protocols.
Tstat builds histograms of measured indexes, dumping the collected distribution periodically (every five minutes by default), rather than dumping each single measured datum. The data produced by the online statistical analysis is ready to be visualized, for example, as either time plots or aggregated plots over different time spans. A complete flow-level log, which is useful for post-processing purposes, tracks all analyzed transport layer flows by including all the performance indexes for later post-processing. Finally, Tstat has been integrated with RRDtool: the whole measurement index can now be stored as a round robin database. Since the RRD database has a fixed size, this allows everlasting live-capture without compromising the statistical relevance of the data.
Publications
- Mellia, M., Carpani, A., & Lo Cigno, R. (2003, February). Tstat: TCP statistic and analysis tool. In International Workshop on Quality of Service in Multiservice IP Networks (pp. 145-157). Berlin, Heidelberg: Springer Berlin Heidelberg.
- Mellia, M., Cigno, R. L., & Neri, F. (2005). Measuring IP and TCP behavior on edge nodes with Tstat. Computer Networks, 47(1), 1-21.
- Finamore, A., Mellia, M., Meo, M., Munafo, M. M., Di Torino, P., & Rossi, D. (2011). Experiences of internet traffic monitoring with tstat. Ieee Network, 25(3), 8-14.
- Trevisan, M., Finamore, A., Mellia, M., Munafo, M., & Rossi, D. (2017). Traffic analysis with off-the-shelf hardware: Challenges and lessons learned. IEEE Communications Magazine, 55(3), 163-169.
- Trevisan, M., Giordano, D., Drago, I., Mellia, M., & Munafo, M. (2018, December). Five years at the edge: Watching internet from the isp network. In Proceedings of the 14th International Conference on Emerging Networking EXperiments and Technologies (pp. 1-12).
Web Interface
The web interface showing PoliTO traffic statistics is available here.
Example Dataset
Network traces, which are available for the research community, are libpcap-consistent.
In order to respect privacy, IP addresses have been anonymized and the IP checksum of packets has been corrected using Anonymizer tool (v. 0.5) developed by University Federico II, Naples, Italy. Anonymizer tool is available here.
Log TCP Trace
This log has been collected using the Tstat probe (running Tstat-3.0) installed at the egress link of our campus network during November 2015. The trace contains all TCP flows observed considering a one-hour long time interval. The trace have been collected and made shareable with the support of the mPlane project. In order to respect privacy, IP addresses have been anonymized, and any sensitive information has been removed.
The file has been compressed using xz, which reduced its size to 339MB from the original 2.1GB. The file can be easily accessed by using xzcat and using a pipe to input the uncompressed data to the post-processing script/command (e.g., “xzcat log_tcp_complete.xz | head -n 10“).
Examples of post-process commands:
1) Count the number of flows whose FQDN field contains “facebook”:
xzcat log_tcp_complete.xz | awk '$127 ~ "facebook" {cnt++} END {print cnt}'
2) Count the number of flows carrying HTTP or HTTPS traffic, headed to “facebook” and generated by internal clients:
xzcat log_tcp_complete.xz | awk '$38 == 1 && $127 ~ "facebook" && ($42 == 1 || $42 == 8192) {cnt++} END {print cnt}'
3) Count the number of server IP addresses associated with “facebook” flows:
xzcat log_tcp_complete.xz | awk '$127 ~ "facebook" {sips[$15] = 1} END {print length(sips)}'
or
xzcat log_tcp_complete.xz | awk '$127 ~ "facebook" {print $15}' | sort | uniq | wc -l
The file is available here.
MONROE Traces
The following traces, which are available for the research community, refer to Tstat tcp complete logs and monroe modem metadata. Datasets have been collected and organized with the support of the MONROE project.
The goal of this research is to collect a wide range speedtest-like traces for the mobile broadband (MBB) networks, as seen from actual users. In our experiment, the MONROE node contains the core components, with containers that run active experiments. Traffic generated by the applications passes through the selected MiFi modem where a NAT is in place, then goes through the ISP network, and the Internet, toward the selected server. Each node runs also Tstat, a specialized passive sniffer. Tstat captures traffic on each MBB interface and extracts statistics by passively observing packets exchanged with the network. Another instance of Tstat runs on the server side, thus capturing and processing traffic at the other end of the path.
Each MONROE node regularly runs a basic set of experiments. Among these, the HTTP download experiment uses single thread curl to download a 40 MB file for a maximum of 10 seconds from dedicated and not-congested servers in Sweden. we collected measurements during September and October 2016 in four countries and different sites. We consider only stationary nodes. The experiment ran every 3 hours in synchronized fashion. The active application and passive flow-level traces on the client and server sides cannot give us information about the technology and signal strength at the MBB channel during the experiment. Therefore, we use the metadata collected by the MONROE platform to augment the information about the access link status. The MONROE metadata are event-based data collected by passively monitoring the statistics exposed directly from the MiFi modems through their management interface. This data is transmitted and stored in the project database for analysis, and can be easily correlated to each node and interface.
This datasets contains csv files (comma separated):
clients_tstat_tcp_log.zip: Some of fields in Tstat tcp log at the client side (MONROE node) that we used in our analysis.server_tstat_tcp_log.zip: Some of fields in Tstat tcp log at the server side in (193.10.227.25) that we used in our analysis.- monroe_meta
_device_modem.zip: Some of fields in monroe metadata at the client side (MONROE node) that we used in our analysis.
The first line of each file specifies the data inside the file; for monroe_meta_device_modem.csv check here.
The data are available here.