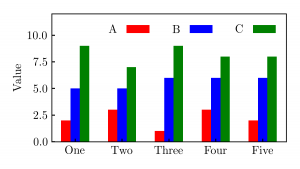
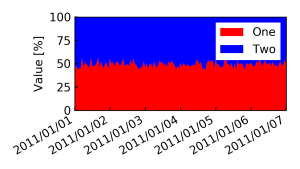
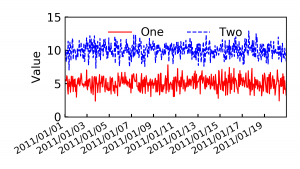
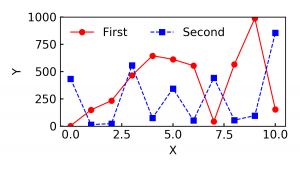
Create publication-quality plots with a simple interface over matplotlib. Are you bored of copying and pasting the code to make a plot every time? Try this!
This module provides only one (highly customizable) function to plot some data. It uses matplotlib in its internal, but helps in setting all graphical and plot paramenters (tick rotate, font, size, etc.).
The library has been writter by SmartData@PoliTO’s collaborator Martino Trevisan.
You can find install instructions and usage examples on GitHub.


