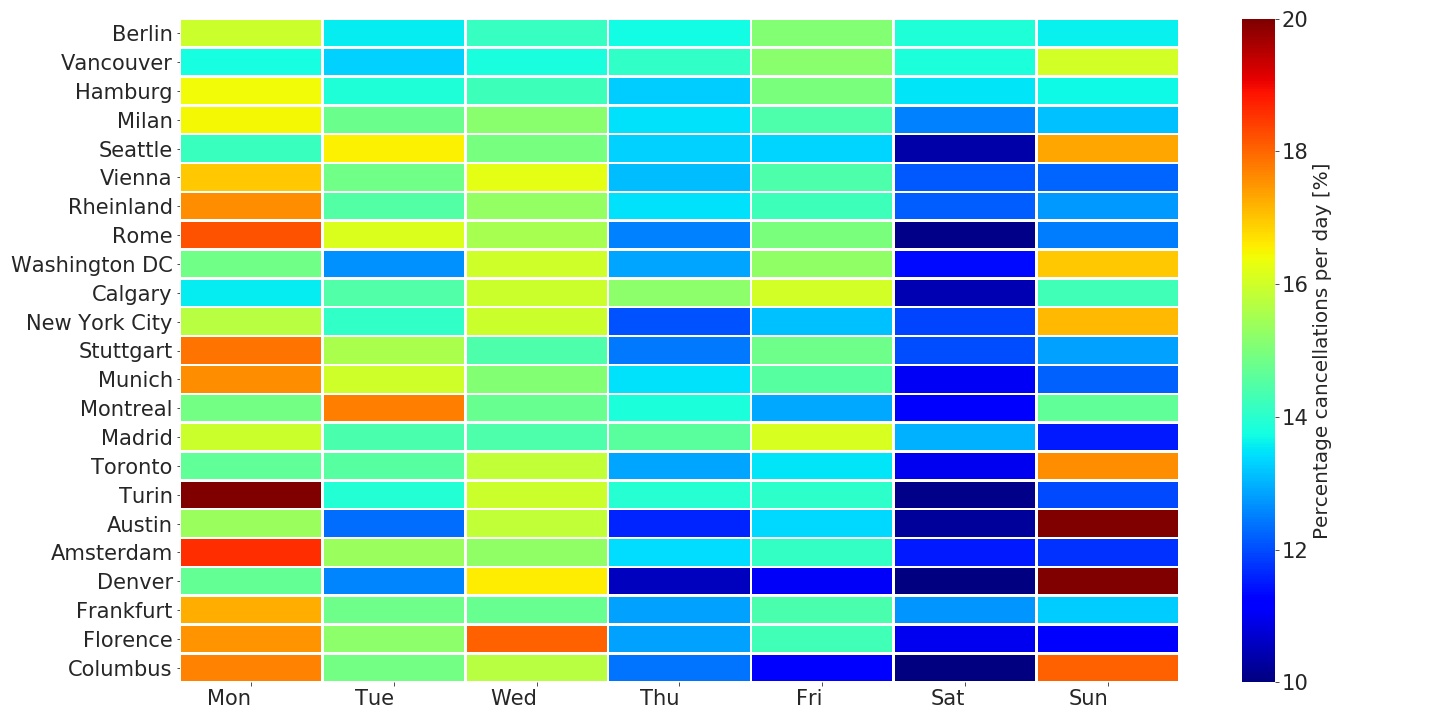
After having witnessed the diffusion of car sharing systems during the lastdecade, the research community has posed a number of relevant questions abouttheir current utilization trends in different contexts, their growth perspectives,and the gradual shift towards more sustainable and efficient technologies. Sincea large and heterogeneous amount of car sharing usage data is now available,researchers have started to address the aforesaid issues through data-driven ap-proaches.In this paper, we provide a extensive usage characterization of the FreeFloating Car Sharing (FFCS) services provided in 23 cities in Europe and NorthAmerica over a 14-month period. We describe FFCS services in terms of fleetsize, operative area, and characteristics of car bookings and rentals. We iden-tify also temporal patterns that are peculiar to specific cities and countries aswell as spatial recurrences describing urban zones with high attractiveness orwith high rental generation rate. Finally, we compare the systems relying oninternal combustion cars with those based on electric vehicles in terms of vari-ous indicators, including the effects on booking cancellations and on charge/fillevents.The results show significantly variable patterns across different cities andcountries. The insights provided by empirical evidences allow system managersto assess profitability and sustainability of the services under multiple aspects.
Dataset Samples
Anonymized datasaset of 2 months of trips of car sharing users in the city of Turin.
Anonymized datasaset of 2 months of trips of car sharing users in the city of Vancouver.
Interactive Graphs
We provide below interactive graphs for the extraction of further details related to different FFCS analysis.
Rental Characterization


Daily Characterization per Vehicle


Monthly Trends


Daily Trends


Hourly/Daily Characterization
Rentals Distribution

Average Rentals Duration

Average Rentals Distance

Spatial Analysis
Rental Departure Location

Generative and Attractive Locations

Generative and Attractive Time Slots

