In this page we provide further results and the script to replicate the figures of the papers:
- M. Barulli, A. Ciociola, M. Cocca, L. Vassio, D. Giordano, M. Mellia. On Scalability of Electric Car Sharing in Smart Cities. In: 2020 IEEE International Smart Cities Conference (ISC2), pp. 1-8, 2020. DOI: 10.1109/ISC251055.2020.9239086
- A. Ciociola, D. Giordano, L. Vassio, M. Mellia. Design Options and Economic Impact of Electric CarSharing: A Data-driven Approach. In Information Sciences, 2022, DOI: 10.1016/j.ins.2022.11.116
The cost model allows one to interactively observe what happens by changing the cost values.
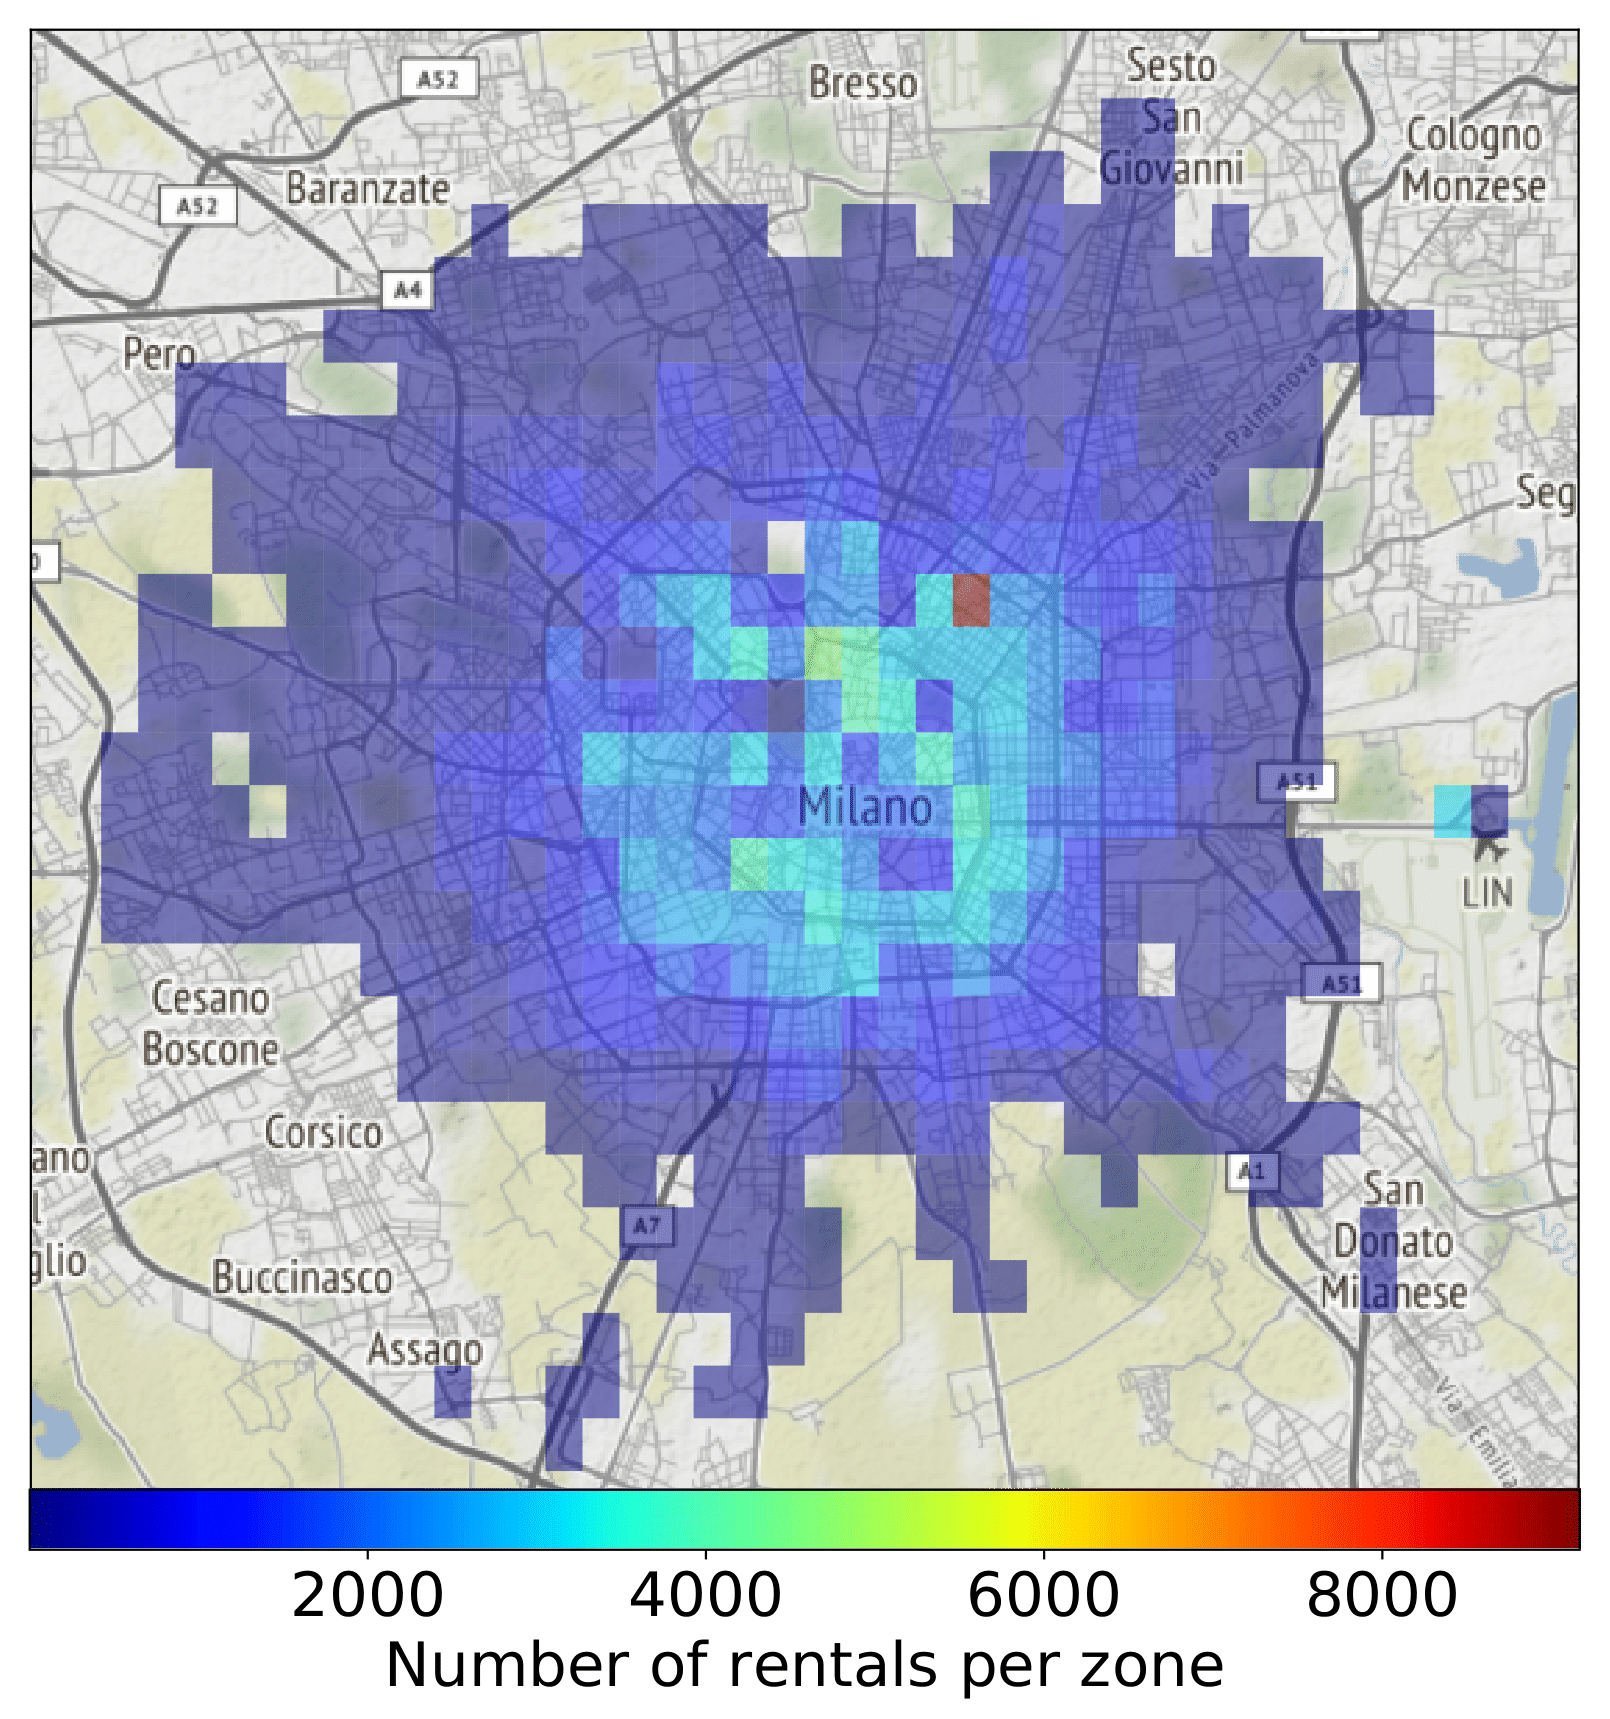
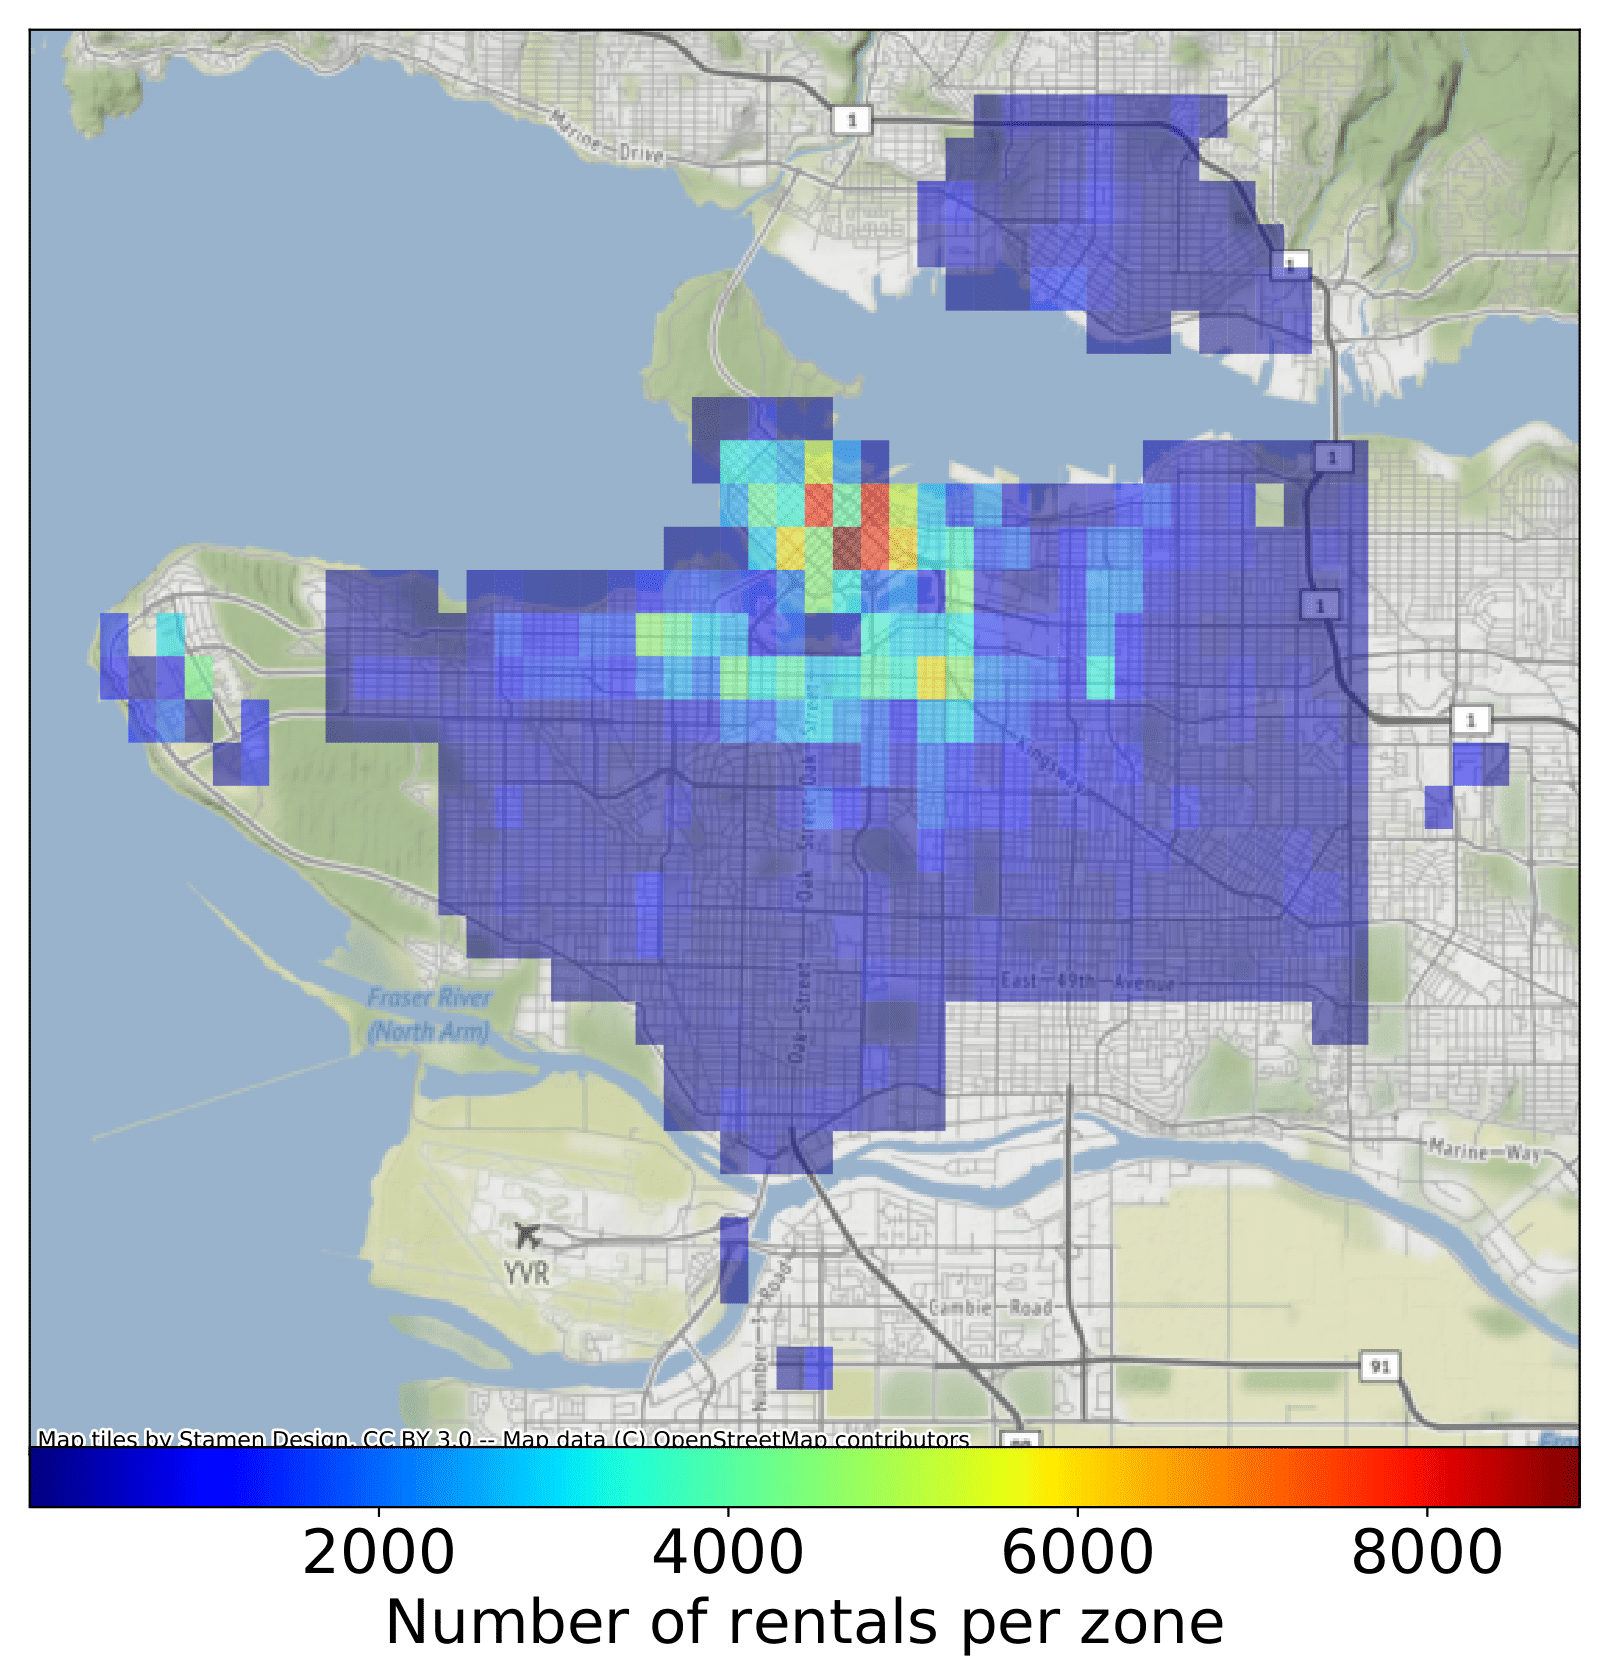
Traffic Data and Models
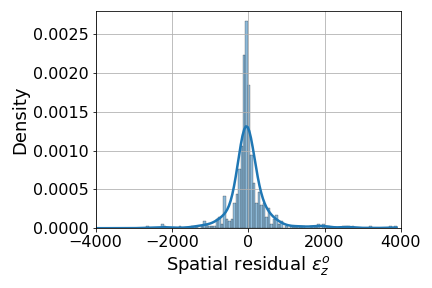
Temporal ResidualTurin
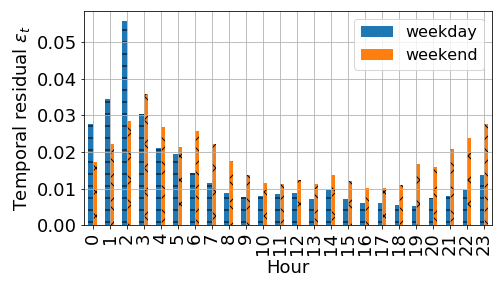
Milan
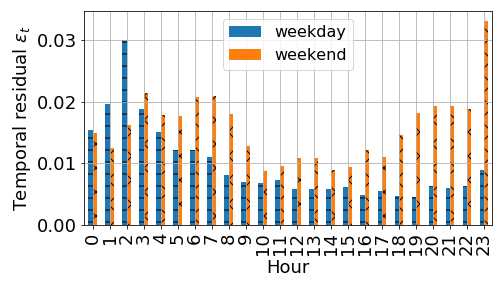
Vancouver
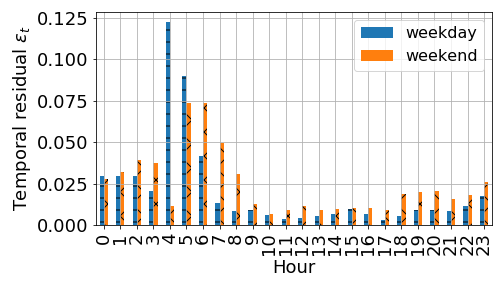
Turin
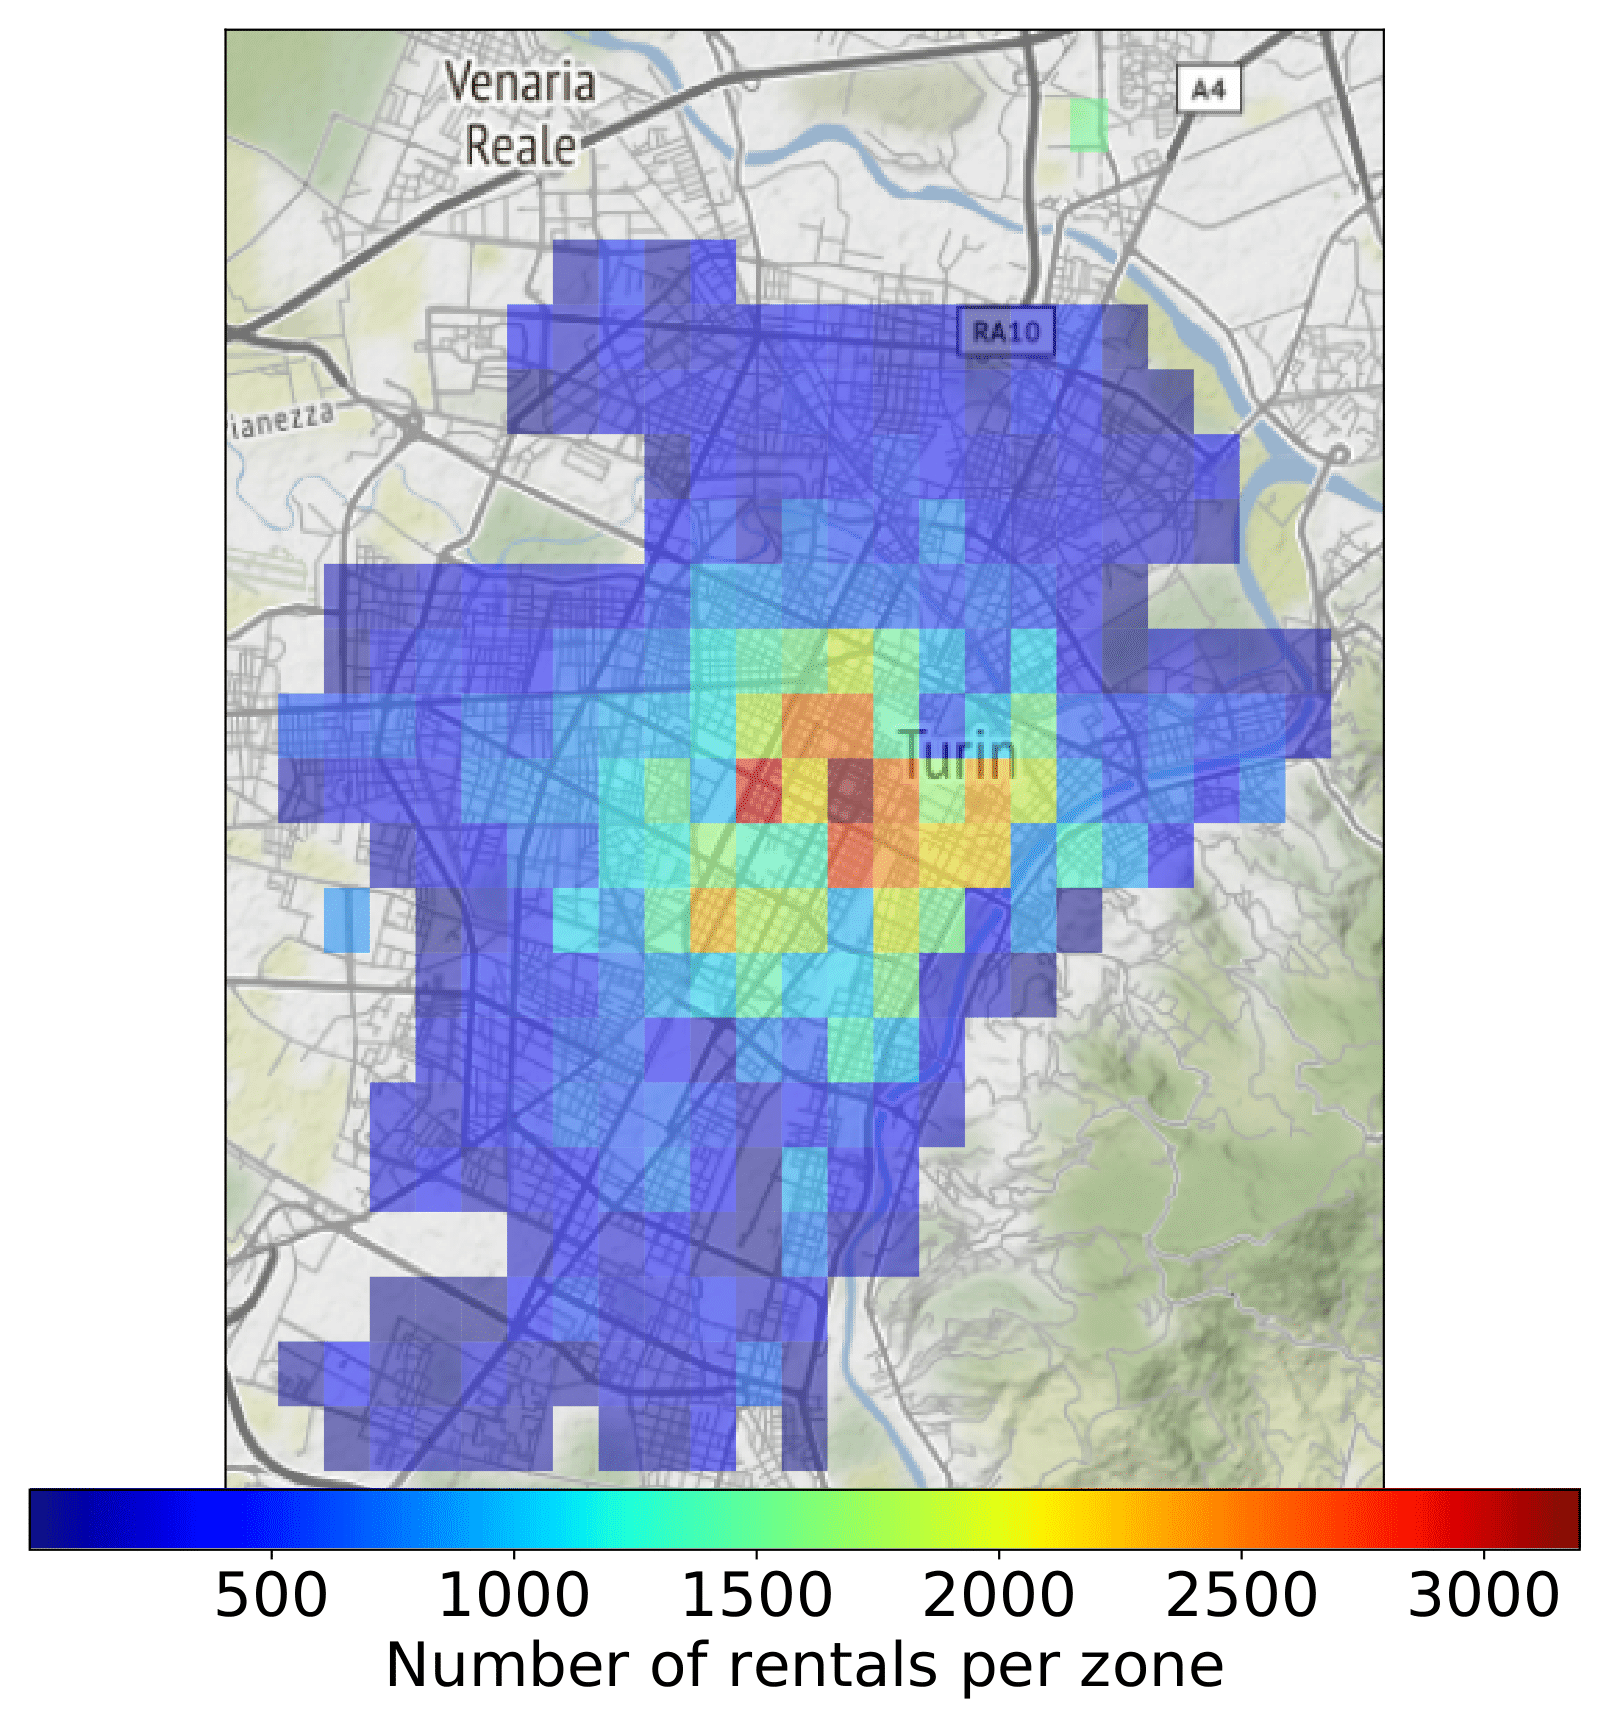
Milan
Vancouver
Turin
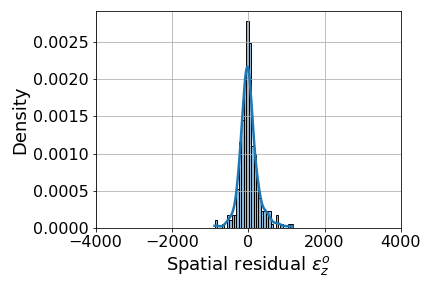
Milan
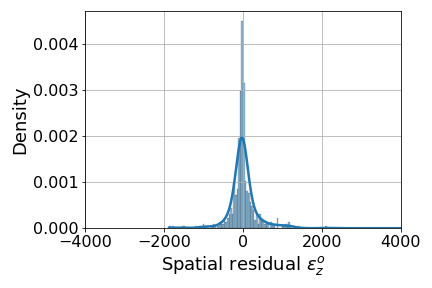
Vancouver
Dowload Jupyter notebook and data for “On Scalability of Electric Car Sharing in Smart Cities”.
The shared Jupyter notebooks are meant to replicate the results of the paper.
Each notebook has the same simple structure:
- Read simulation results and city specific data -> create a results dataframe called “sim_stats_df”
- (eventually) compute new metrics from the one available in sim_stats_df
- (eventually) configure economic parameters in a provided .json configuration
- Plot results
The folder is structured as follows:
- figg_4a_4b_5a_5b.ipynb
- In this notebook it is possible to study unsatisfied demand and charging handling time as a function of fleet size and number of charging poles.
- figg_4c_5c.ipynb
- In this notebook it is possible to study unsatisfied demand and charging handling time as a function of number of charging zones.
- figg_6_7_11_12.ipynb
- In this notebook it is possible to study unsatisfied demand and profit as a function of lambda in case of under-sized and over-sized charging infrastructure. Cost and revenue parameters are easily modifiable to check alternative scenarios.
- figg_9_10_13_14.ipynb
- In this notebook it is possible to study unsatisfied demand and profit as a function of fleet size and number of chargers. Cost and revenue parameters are easily modifiable to check alternative scenarios.
- simulation_results: folder containing configurations (.json) and results (.csv, .pickle) of the whole simulation campaign.
- figures: folder containing plots created in the notebook.
- ieee_iscc2020.mplstyle: configuration file for plotting style.
